Reason to trust

How Our News is Made
Strict editorial policy that focuses on accuracy, relevance, and impartiality
Ad discliamer
Morbi pretium leo et nisl aliquam mollis. Quisque arcu lorem, ultricies quis pellentesque nec, ullamcorper eu odio.
RubyCoin Price Key Highlights
- Rubycoin price continued to trade higher as it moved closer to 0.0002257BTC.
- A new weekly high was formed as highlighted during this past week’s analysis, and looks set for more gains in the near term.
- There is a support trend line on the hourly chart of the Rubycoin price, which might act as a buy area.
Rubycoin price moved higher this past week, and it looks like it might continue to trade higher moving ahead.
Trend Line Support Area
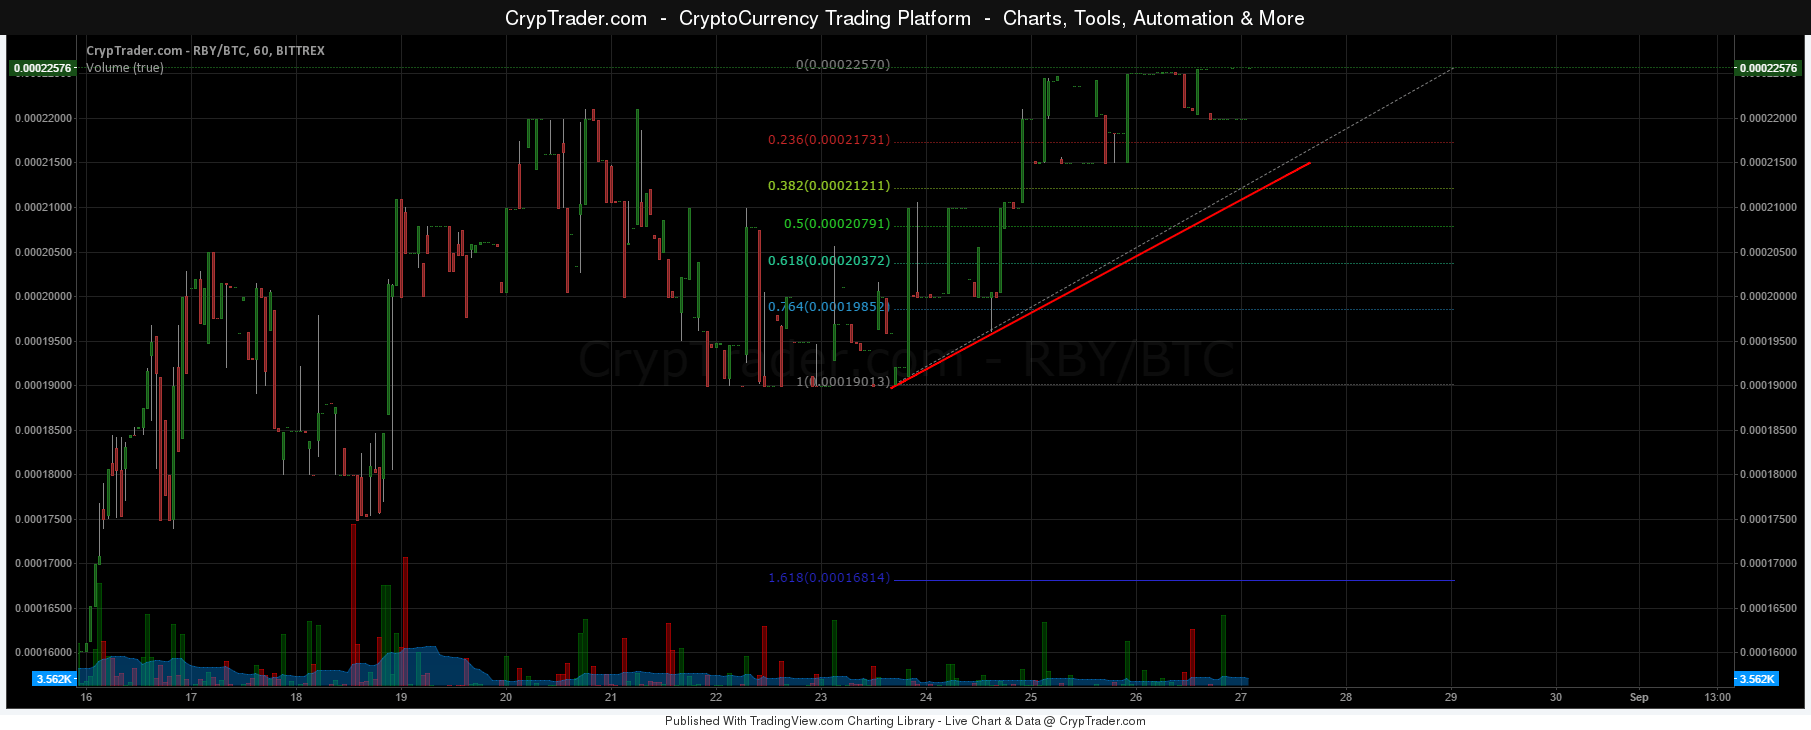
The Rubycoin price moved higher this week, and also cleared the last swing high of 0.00022BTC. The price traded as high as 0.0002257BTC where it found sellers and currently struggling to clear the mentioned fib level. The price might move lower, and head towards the 23.6% Fib retracement level of the last wave from the 0.0001903BTC low to 0.0002257BTC high. However, the most important point is that there is a bullish trend line formed on the hourly chart of the Rubycoin price.

If the price moves lower from the current levels, then the highlighted trend line and support area might act as a barrier for sellers. A break below the trend line and support area could ignite more losses and call for a change in the trend. The next level of interest in that situation could be around the 50% fib area. Any further losses might be difficult considering the fact that the sentiment is in favor of buyers currently.
On the upside, the last high of 0.0002257BTC might continue to act as a resistance. If there is a break above the mentioned level then the price could head towards 0.00025BTC.
Intraday Support Level – 0.0002121BTC
Intraday Resistance Level – 0.0002257BTC
Overall, the price is in the bullish area, which means there is a chance of more gains.
Charts courtesy of Cryptrader


