The daily XRP chart has turned into a clean Elliott Wave case study, according to crypto technician “Charting Guy,” who argues the latest rebound was corrective rather than impulsive and likely precedes a deeper C-wave pullback toward August’s lows. In a post on X, he wrote: “August bounce from $2.72 to $3.38 was a 3 wave corrective move up unlike $OTHERS 5 wave impulsive move up, so I believe it was a B wave & we will likely revisit the August lows in the coming days/weeks for our C wave to end the correction that started late July.”
XRP Correction Isn’t Over Yet
The annotated chart (XRP/USD) plots a developing five-wave sequence with waves 1 and 2 completed in May and June, a vertical wave 3 peak into mid-July, and an unfolding A-B-C that would finalize wave 4. The A leg knifed off the wave-3 high, a B-wave recovery carried to $3.40, and the projected C leg descends into a Fibonacci cluster that coincides with the August trough. At the time of the snapshot, XRP was quoted around $3.02881 on the daily close, sitting between the 0.786 and 0.888 retracement rails.

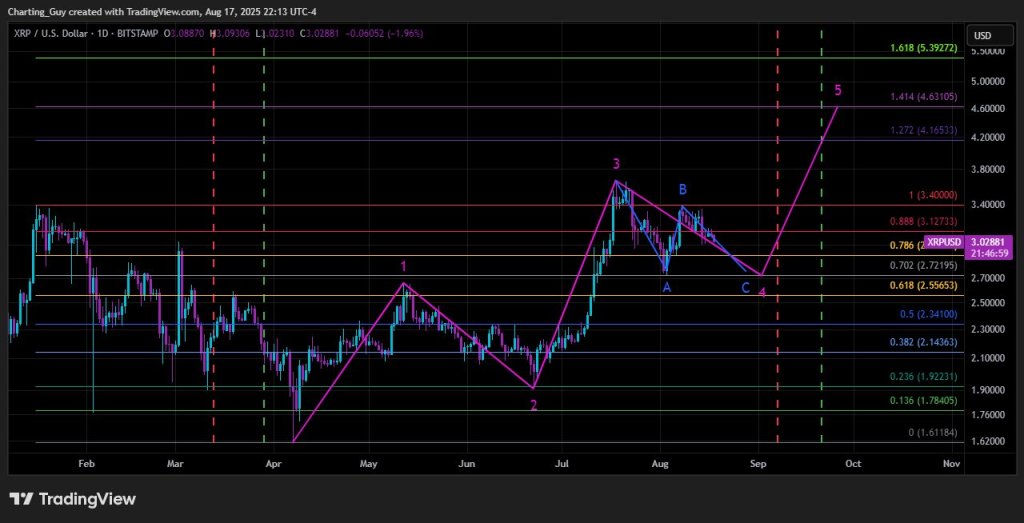
Fibonacci scaffolding dominates the chart and defines the key levels the analyst is trading against. The retracement and extension ladder is printed as follows: 0 at $1.61184, 0.136 at $1.78405, 0.236 at $1.92231, 0.382 at $2.14363, 0.5 at $2.34100, 0.618 at $2.55653, 0.702 at $2.72195, 0.786 at $2.87293, 0.888 at $3.1273, and 1.000 at $3.4000.
Above the prior high, the upside extensions that map the prospective wave-5 run are marked at 1.272 ($4.16533), 1.414 ($4.63105) and 1.618 ($5.39272). The B-wave stall unfolded beneath the $3.1273–$3.4000 resistance band (0.888–1.000), reinforcing that region as the ceiling the market must clear to confirm a finished correction.
Conversely, the proposed C-wave termination zone is anchored by the 0.786–0.702–0.618 stack at $2.87293 / $2.72195 / $2.55653, with the August pivot specifically highlighted at ~$2.72.
A downward-sloping magenta trendline from the wave-3 apex bisects the A-B-C, and the projected path drives price into a labeled “4” before turning sharply higher into a new advance.
The terminal “5” marker is placed almost exactly at the 1.414 extension near $4.63105—consistent with the author’s own wording that this represents a conservative target zone—while the 1.618 print at $5.39272 frames an obvious stretch objective if momentum over-delivers.
Addressing community questions about his previous higher target of $8, the analyst replied, “is there anywhere in the post that says no more $8 target?” and, when asked about an extended move in November, he answered “maybe. Maybe.” On positioning, he cautioned that “dips are never guaranteed even if they seem likely,” adding: “hodl imo… use trading options or futures or a trading spot bag to make their short term gains.”
The immediate read is unambiguous: unless XRP can reclaim and hold above $3.1273 and then $3.4000, Charting Guy’s roadmap favors a retest of the August floor near $2.72195 to complete wave 4. Only after such a flush—or a decisive invalidation via resistance break—does his schematic open the door to the next impulsive leg targeting $4.16533 to $4.63105, with $5.39272 reserved for an extended fifth in late-September or early-October.
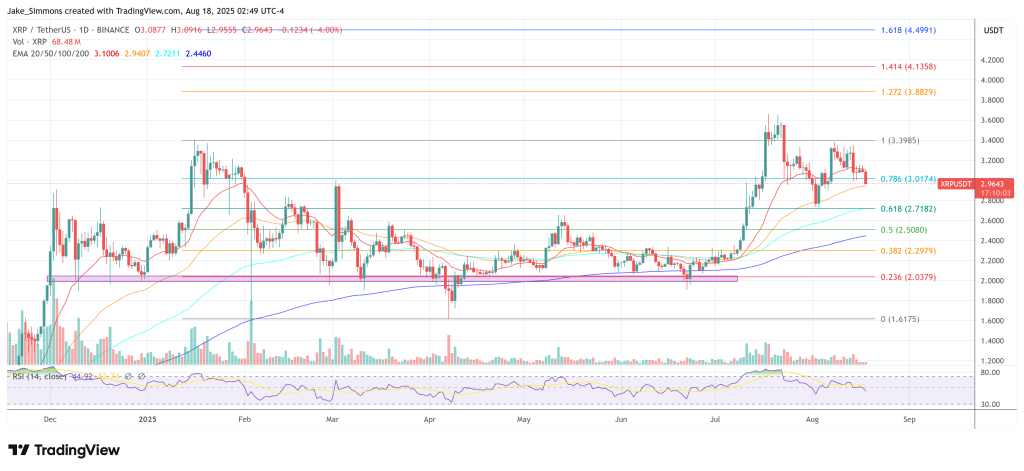
At press time, XRP traded at $2.96.