Reason to trust
Strict editorial policy that focuses on accuracy, relevance, and impartiality
Created by industry experts and meticulously reviewed
The highest standards in reporting and publishing
How Our News is Made
Strict editorial policy that focuses on accuracy, relevance, and impartiality
Ad discliamer
Morbi pretium leo et nisl aliquam mollis. Quisque arcu lorem, ultricies quis pellentesque nec, ullamcorper eu odio.
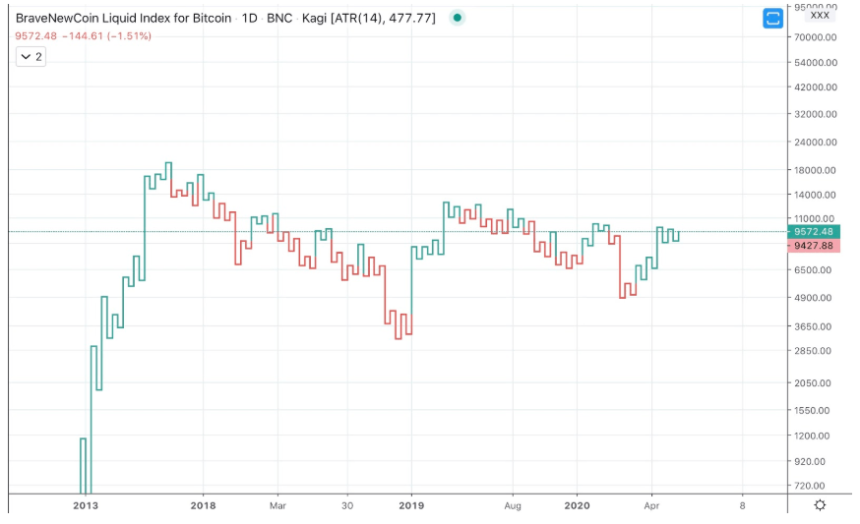
Much like Renko changes the entire shape and formation of a candlestick chart, so does Kagi, another type of chart. Kagi is yet another type of chart designed by the Japanese.
This type of chart utilizes a series of vertical lines referencing an asset’s price action. Each line moves horizontally with each close.
Kagi specifically omits time as a factor in chart analysis, also helping to reduce noise and give a clearer picture of trends.


