Reason to trust
Strict editorial policy that focuses on accuracy, relevance, and impartiality
Created by industry experts and meticulously reviewed
The highest standards in reporting and publishing
How Our News is Made
Strict editorial policy that focuses on accuracy, relevance, and impartiality
Ad discliamer
Morbi pretium leo et nisl aliquam mollis. Quisque arcu lorem, ultricies quis pellentesque nec, ullamcorper eu odio.
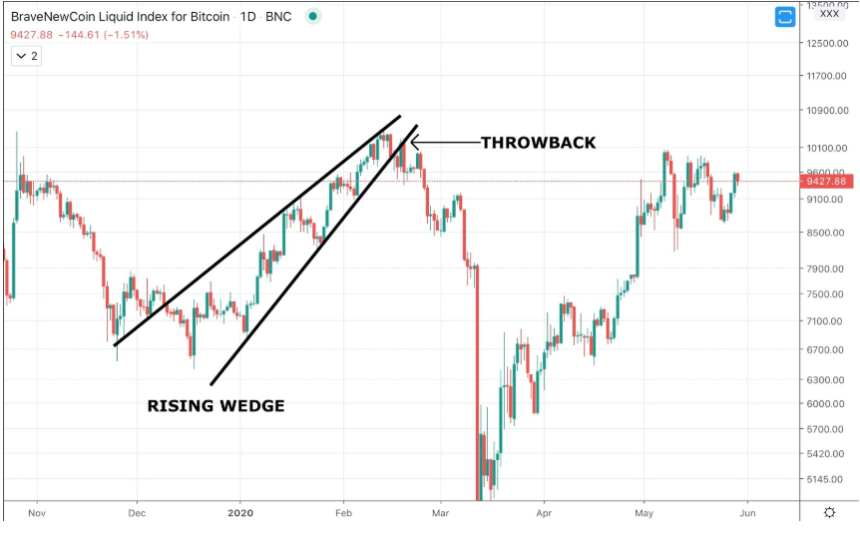
The peaks and troughs of all price action across all time frames often result in the formation of price patterns.
Common price patterns include flags, pennants, triangles, wedges, and more. These patterns can signal bullish or bearish results, depending on the type of pattern and the angle of the trend lines.
These chart patterns can also be used to assist traders in what positions to take, and what key price levels to watch.


