Reason to trust
How Our News is Made
Strict editorial policy that focuses on accuracy, relevance, and impartiality
Ad discliamer
Morbi pretium leo et nisl aliquam mollis. Quisque arcu lorem, ultricies quis pellentesque nec, ullamcorper eu odio.
Toncoin (TON) has gained significant upward momentum, recently breaking above the 100-day Simple Moving Average (SMA) on the 4-hour chart. This bullish move signals strong buying interest that could potentially put the crypto asset on the path to the $7.6 resistance level.
The breakout above this key technical indicator suggests that the bulls are in control, setting the stage for a continued rally. This article analyzes Toncoin’s recent breakout above the 100-day SMA on the 4-hour chart, assesses market sentiment, and evaluates the significance of the $7.6 resistance level as the next major target.
Toncoin was trading at approximately $6.50, marking an increase of over 3.55%, with a market capitalization exceeding $16 billion and a trading volume of more than $960 million at the time of writing. Over the past 24 hours, the asset’s market cap has risen by over 3%, while its trading volume has surged by more than 36%.
Market Sentiment: Bulls In Control Of TON’s Rally
Currently, the price of Toncoin on the 4-hour chart has been on a bullish move advancing above the 100-day Simple Moving Average (SMA) toward the $7.6 resistance mark. The breach above this key indicator indicates continued bullish control and the potential for further upward movement.
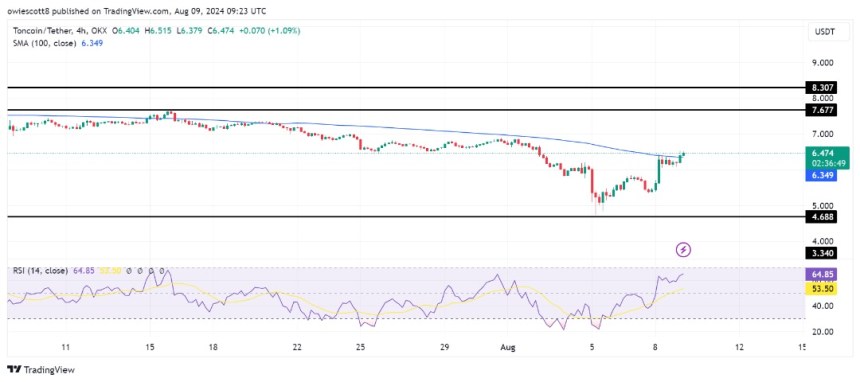
Additionally, a 4-hour Relative Strength Index (RSI) analysis reveals that the indicator’s signal line has successfully climbed above 50% and is now approaching the 70% mark, which is considered the overbought zone. This suggests that buying pressure is increasing, potentially leading to further upward movement for the asset.
On the 1-day chart, although Toncoin is still trading below the 100-day SMA, it has successfully formed bullish momentum candlesticks, aiming for both the 100-day SMA and the $7.6 resistance level, which means that the bulls are still in control and could potentially push the price higher.
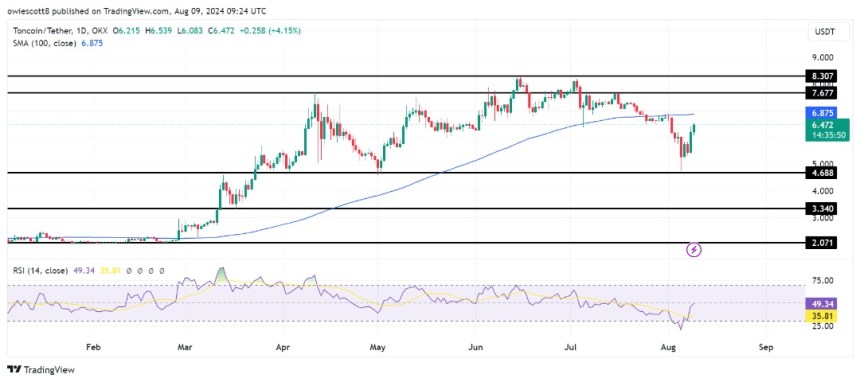
Finally, on the 1-day chart, the RSI signal line has climbed more than 35% from the oversold zone and is currently approaching 50%, suggesting growing bullish momentum for the cryptocurrency.
Potential Scenarios: Will Toncoin Reach $7.6 Or Face Rejection?
In the event that TON’s price reaches and breaks above the $7.6 resistance level, the crypto asset could continue to rise, testing its all-time high of $8.30 and potentially setting a new all-time high once it surpasses this mark.
However, if Toncoin reaches the $7.6 resistance level and faces a rebound, it might start to decline toward the $4.6 support mark. Should the price fall below this support, it could drop further to test the $3.3 support level and potentially continue to lower support ranges on the chart if the $3.3 price target is breached.