
Reason to trust
How Our News is Made
Strict editorial policy that focuses on accuracy, relevance, and impartiality
Ad discliamer
Morbi pretium leo et nisl aliquam mollis. Quisque arcu lorem, ultricies quis pellentesque nec, ullamcorper eu odio.
Tron price is gaining pace above $0.0780 against the US Dollar. TRX is outperforming Bitcoin and could rally further above the $0.0800 resistance.
- Tron is moving higher above the $0.0750 pivot level against the US dollar.
- The price is trading above $0.078 and the 100 simple moving average (4 hours).
- There was a break above a major contracting triangle with resistance near $0.0770 on the 4-hour chart of the TRX/USD pair (data source from Kraken).
- The pair could continue to climb higher toward $0.088 or even $0.10.
Tron Price Breaks Higher
In the last Tron price prediction, we discussed the chances of an upside break against the US Dollar. TRX remained well-bid and stable above the $0.0750 level.
It started a decent increase and broke a few key hurdles near $0.0775, outperforming Bitcoin. There was a break above a major contracting triangle with resistance near $0.0770 on the 4-hour chart of the TRX/USD pair. The pair even cleared the $0.0785 level.
A high is formed near $0.0793 and the price is now consolidating gains above the 23.6% Fib retracement level of the upward move from the $0.0751 swing low to the $0.0793 high.
TRX is trading above $0.078 and the 100 simple moving average (4 hours). On the upside, an initial resistance is near the $0.0795 level. The first major resistance is near $0.080, above which the price could accelerate higher. The next resistance is near $0.088.
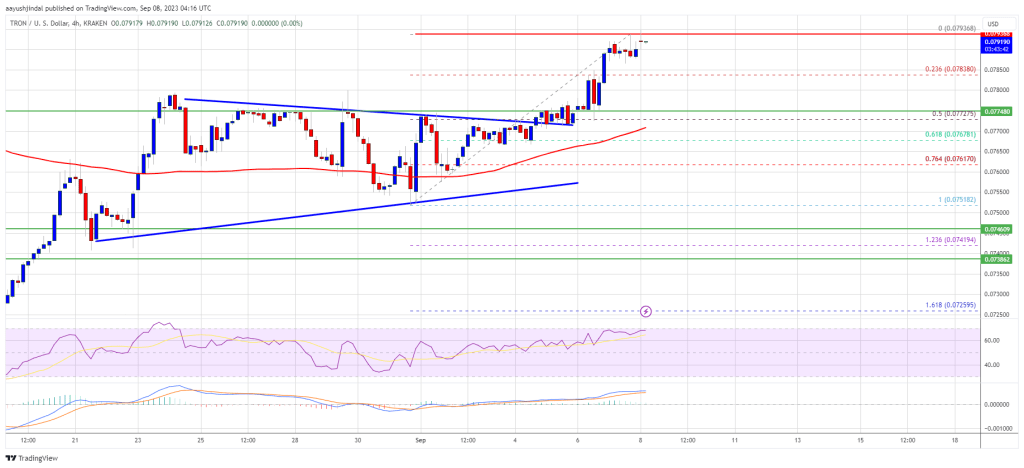
Source: TRXUSD on TradingView.com
A close above the $0.0880 resistance might send TRX further higher. The next major resistance is near the $0.095 level, above which the bulls are likely to aim a larger increase toward the key $0.10 zone in the coming days.
Are Dips Limited in TRX?
If TRX price fails to clear the $0.080 resistance, it could start a downside correction. Initial support on the downside is near the $0.0780 zone.
The first major support is near the $0.0770 level or the 50% Fib retracement level of the upward move from the $0.0751 swing low to the $0.0793 high, below which the price could accelerate lower. The next major support is $0.0750.
Technical Indicators
4 hours MACD – The MACD for TRX/USD is gaining momentum in the bullish zone.
4 hours RSI (Relative Strength Index) – The RSI for TRX/USD is currently above the 50 level.
Major Support Levels – $0.0780, $0.0770, and $0.0750.
Major Resistance Levels – $0.080, $0.0880, and $0.100.


