
Reason to trust
How Our News is Made
Strict editorial policy that focuses on accuracy, relevance, and impartiality
Ad discliamer
Morbi pretium leo et nisl aliquam mollis. Quisque arcu lorem, ultricies quis pellentesque nec, ullamcorper eu odio.
Tron price is rising and trading above $0.0760 against the US Dollar. TRX is outperforming Bitcoin and could rally further toward the $0.0820 resistance.
- Tron is moving higher from the $0.0720 support zone against the US dollar.
- The price is trading above $0.0760 and the 100 simple moving average (4 hours).
- There is a key bullish trend line forming with support near $0.0762 on the 4-hour chart of the TRX/USD pair (data source from Kraken).
- The pair could continue to climb higher toward $0.080 and $0.0820.
Tron Price Starts Fresh Increase
This past week, Tron’s price saw a sharp decline below the $0.0760 support against the US Dollar, similar to Bitcoin and Ethereum. TRX tested the $0.0715 zone where the bulls took a stand.
A low was formed near $0.0713 and the price started a fresh increase. There was a decent increase above the $0.0740 and $0.0750 resistance levels. It even outperformed Bitcoin in the past couple of sessions and broke the $0.0760 resistance.
There was a move above the 76.4% Fib retracement level of the downward move from the $0.0775 swing high to the $0.0713 low. TRX is now trading above $0.0760 and the 100 simple moving average (4 hours).
There is also a key bullish trend line forming with support near $0.0762 on the 4-hour chart of the TRX/USD pair. On the upside, an initial resistance is near the $0.0790 zone. The first major resistance is near $0.080, above which the price could rise toward the $0.0820 resistance or the 1.618 Fib extension level of the downward move from the $0.0775 swing high to the $0.0713 low.
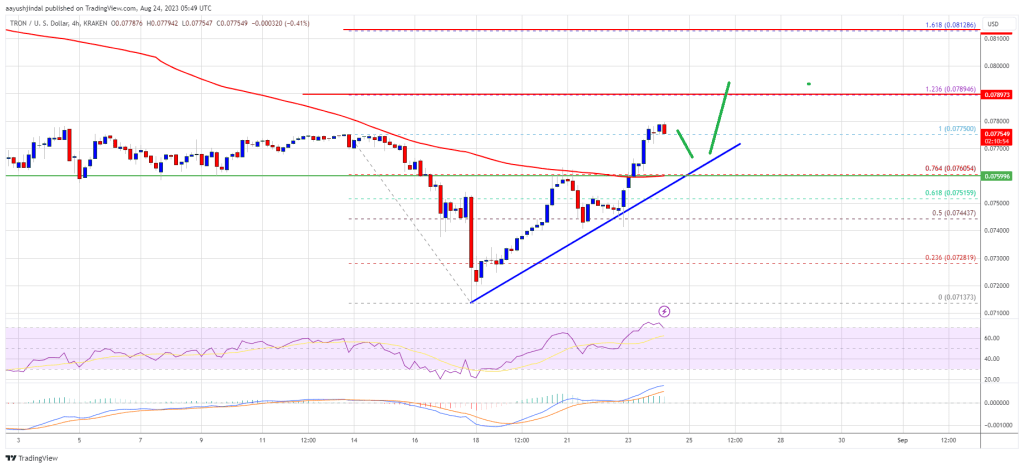
Source: TRXUSD on TradingView.com
A close above the $0.0820 resistance might send TRX further higher. The next major resistance is near the $0.0850 level, above which the bulls are likely to aim a larger increase toward the key $0.0900 zone in the coming days.
Are Dips Limited in TRX?
If TRX price fails to clear the $0.080 resistance, it could start a downside correction. Initial support on the downside is near the $0.0760 zone and the trend line.
The first major support is near the $0.0745 level, below which the price could accelerate lower. The next major support is $0.0715.
Technical Indicators
4 hours MACD – The MACD for TRX/USD is gaining momentum in the bullish zone.
4 hours RSI (Relative Strength Index) – The RSI for TRX/USD is currently above the 50 level.
Major Support Levels – $0.0760, $0.0745, and $0.0715.
Major Resistance Levels – $0.0790, $0.0800, and $0.0820.


