
Reason to trust
How Our News is Made
Strict editorial policy that focuses on accuracy, relevance, and impartiality
Ad discliamer
Morbi pretium leo et nisl aliquam mollis. Quisque arcu lorem, ultricies quis pellentesque nec, ullamcorper eu odio.
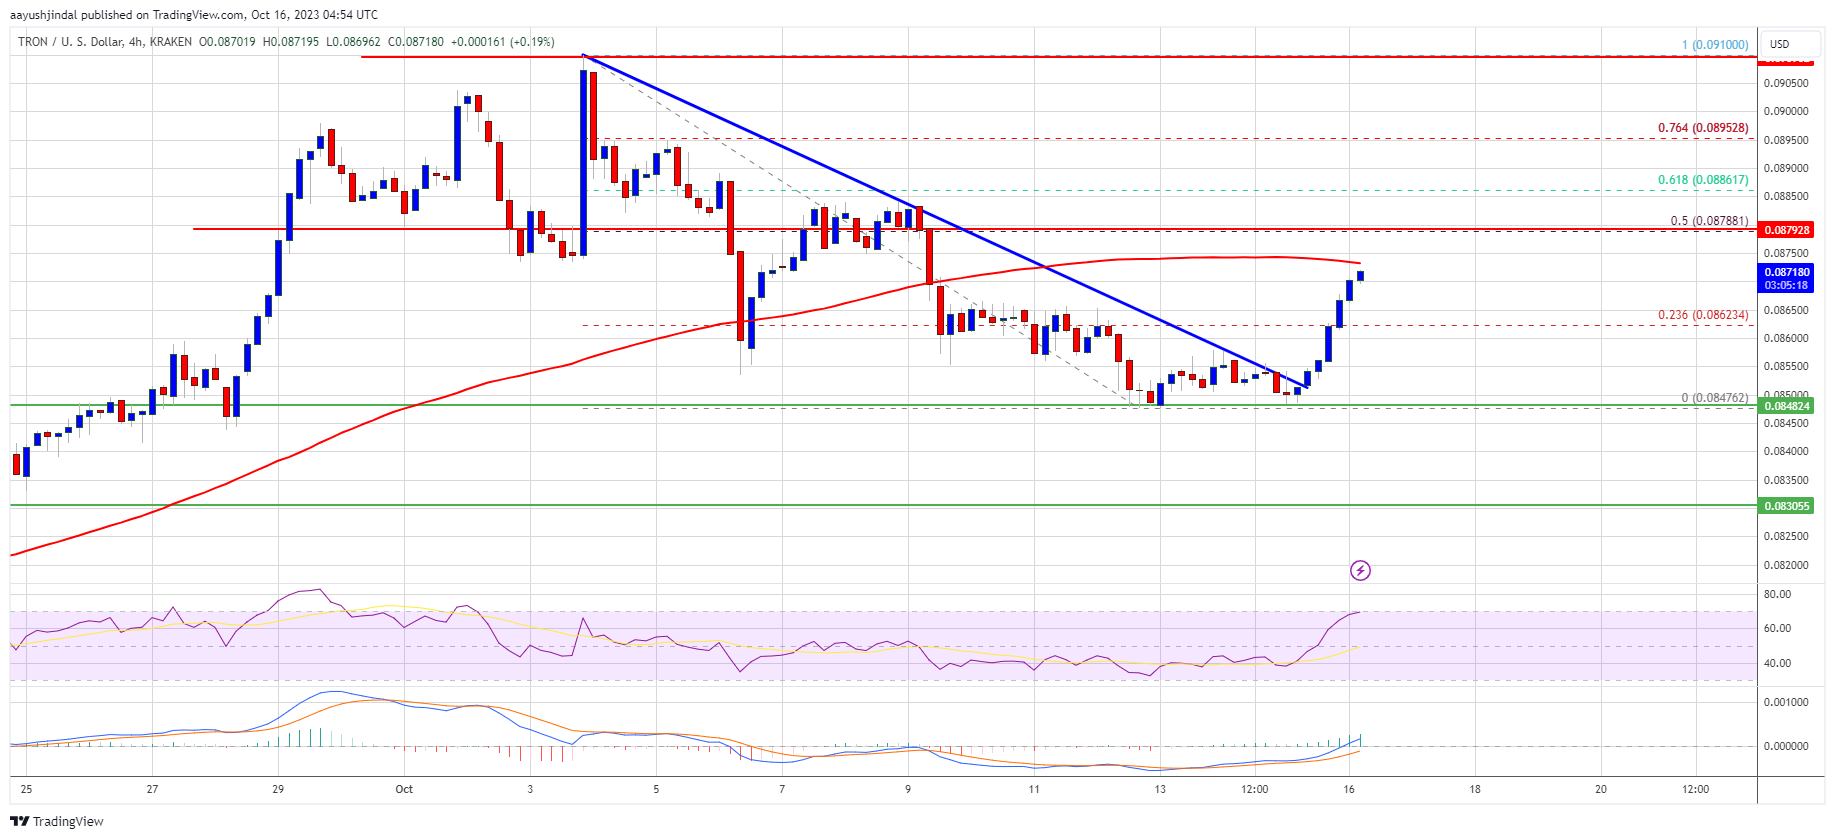
Tron price is gaining pace above $0.0865 against the US Dollar. TRX is outperforming Bitcoin and could rise further toward $0.091.
- Tron is moving higher above the $0.0865 resistance level against the US dollar.
- The price is trading above $0.0870 and the 100 simple moving average (4 hours).
- There was a break above a key bearish trend line with resistance near $0.0850 on the 4-hour chart of the TRX/USD pair (data source from Kraken).
- The pair could continue to climb higher toward $0.0885 or even $0.091.
Tron Price Aims Higher
After facing a rejection near $0.0910, Tron price started a downside correction. TRX declined below the $0.088 and $0.0865 support levels. Finally, it found support near the $0.0850 zone.
A low was formed near $0.0847 and the price is now rising. It broke a couple of hurdles near the $0.0850 level. There was a break above a key bearish trend line with resistance near $0.0850 on the 4-hour chart of the TRX/USD pair.
The pair is up over 2% and outperforming Bitcoin and Ethereum. It also cleared the 23.6% Fib retracement level of the downward move from the $0.0910 swing high to the $0.0847 low.
TRX price is now trading above $0.0870 and the 100 simple moving average (4 hours). On the upside, an initial resistance is near the $0.0875 level and the 100 simple moving average (4 hours). The first major resistance is near $0.0880 or the 50% Fib retracement level of the downward move from the $0.0910 swing high to the $0.0847 low, above which the price could accelerate higher.
Source: TRXUSD on TradingView.com
The next resistance is near $0.091. A close above the $0.091 resistance might send TRX further higher toward $0.095. The next major resistance is near the $0.098 level, above which the bulls are likely to aim for a larger increase toward $0.100.
Fresh Decline in TRX?
If TRX price fails to clear the $0.0875 resistance, it could start a downside correction. Initial support on the downside is near the $0.0862 zone.
The first major support is near the $0.0850 level, below which it could test $0.0847. Any more losses might send Tron toward the $0.0830 support in the coming sessions.
Technical Indicators
4 hours MACD – The MACD for TRX/USD is gaining momentum in the bullish zone.
4 hours RSI (Relative Strength Index) – The RSI for TRX/USD is currently above the 50 level.
Major Support Levels – $0.0862, $0.0850, and $0.0830.
Major Resistance Levels – $0.0875, $0.0880, and $0.0910.


