
Reason to trust
How Our News is Made
Strict editorial policy that focuses on accuracy, relevance, and impartiality
Ad discliamer
Morbi pretium leo et nisl aliquam mollis. Quisque arcu lorem, ultricies quis pellentesque nec, ullamcorper eu odio.
Stellar (XLM) is trading in a bullish zone above the $0.1000 support zone against the US Dollar. XLM price is likely to accelerate towards $0.1200 or even higher if it stays above the $0.1000 support.
- There was a sharp downward move from the $0.1168 monthly high against the US dollar.
- The price found support near the $0.0980 zone and it is currently trading with a bullish angle.
- There is a major bullish trend line forming with support at $0.1040 on the 4-hours chart of the XLM/USD pair (data source from Coinbase).
- The pair is likely to continue higher towards $0.1150 and $0.1200 as long as it is above $0.1000.
Stellar (XLM) is Holding Uptrend
This past week, there was a strong rise in bitcoin, Ethereum and ripple. As a result, stellar (XLM) gained pace above the $0.1000 and $0.1050 resistance levels against the US Dollar. The price even spiked above $0.1100 and it traded as high as $0.1168 before starting a downside correction.
The price dived below the $0.1050 support zone, but the bulls were able to defend the $0.1000 and $0.0980 support levels. A swing low is formed near $0.0951 and the price is currently rising.
There was a break above the $0.1050 level and the price settled well above the 100 simple moving average (4-hours). The bulls pushed the price above the 50% Fib retracement level of the downward move from the $0.1168 high to $0.0951 low.
The price is now facing hurdles near the $0.1120 level. It is close to the 76.4% Fib retracement level of the downward move from the $0.1168 high to $0.0951 low.
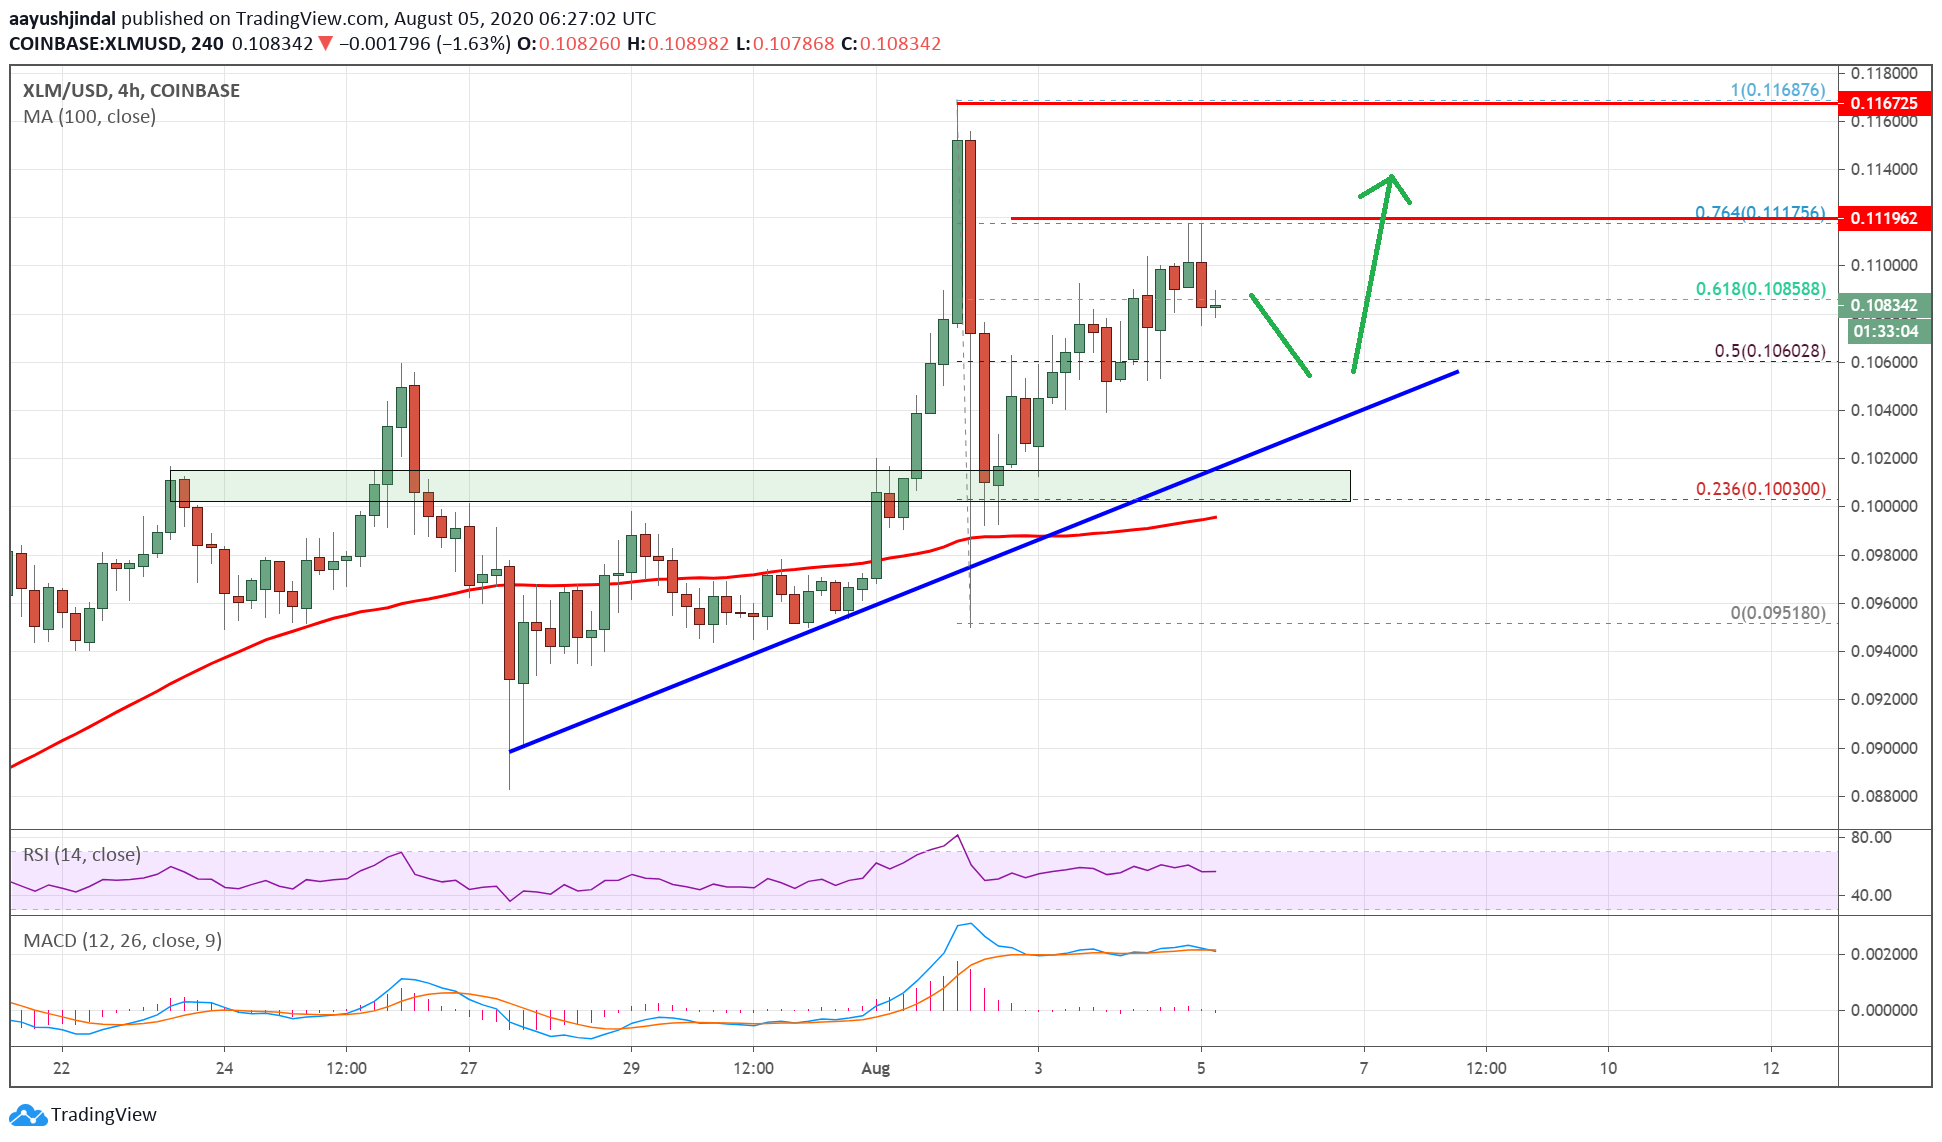
Stellar (XLM) price above $0.1050. Source: TradingView.com
It seems like there is a major bullish trend line forming with support at $0.1040 on the 4-hours chart of the XLM/USD pair. On the upside, the bulls need to clear the $0.1120 level for a fresh increase.
A successful break above the $0.1120 resistance could open the doors for more gains towards the $0.1180 and $0.1200 levels in the coming sessions.
Dips Supported in XLM
If XLM price corrects lower, the bulls are likely to protect the $0.1050 level or the bullish trend line. If there is a break below the trend line and $0.1050, the price could extend losses.
The main support is near the $0.1000 level and the 100 simple moving average (4-hours), below which the price might turn bearish in the short-term.
Technical Indicators
4-hours MACD – The MACD for XLM/USD is slowly losing momentum in the bullish zone.
4-hours RSI (Relative Strength Index) – The RSI for XLM/USD is currently well above the 50 level.
Major Support Levels – $0.1050, $0.1040 and $0.1000.
Major Resistance Levels – $0.1120, $0.1180 and $0.1200.


