Reason to trust

How Our News is Made
Strict editorial policy that focuses on accuracy, relevance, and impartiality
Ad discliamer
Morbi pretium leo et nisl aliquam mollis. Quisque arcu lorem, ultricies quis pellentesque nec, ullamcorper eu odio.
At present, the price of Solana (SOL) is showing signs of recovery from a corrective phase. However, to sustain the momentum, it is crucial for SOL to surpass a significant resistance level. In the past 24 hours, SOL has experienced a 4% increase in value.
Over the course of the past week, the altcoin has displayed notable upward movement, gaining over 9%. Despite the recent price rise, the technical outlook for SOL still leans towards a bearish influence. Both the demand and accumulation for SOL have remained low, indicating a bearish sentiment.
The volatility of Bitcoin, with its price reaching $28,900, has affected the overall market, including altcoins. Although some major altcoins have seen price appreciation, they are still struggling to break through immediate resistance levels.
Related Reading: US Bitcoin Investor Trading Volume Rises, Stage Set For Another Massive Rally?
The stability of the broader market is crucial for the future performance of SOL. The market capitalization of SOL has declined, indicating a higher selling strength in the market
Solana Price Analysis: One-Day Chart

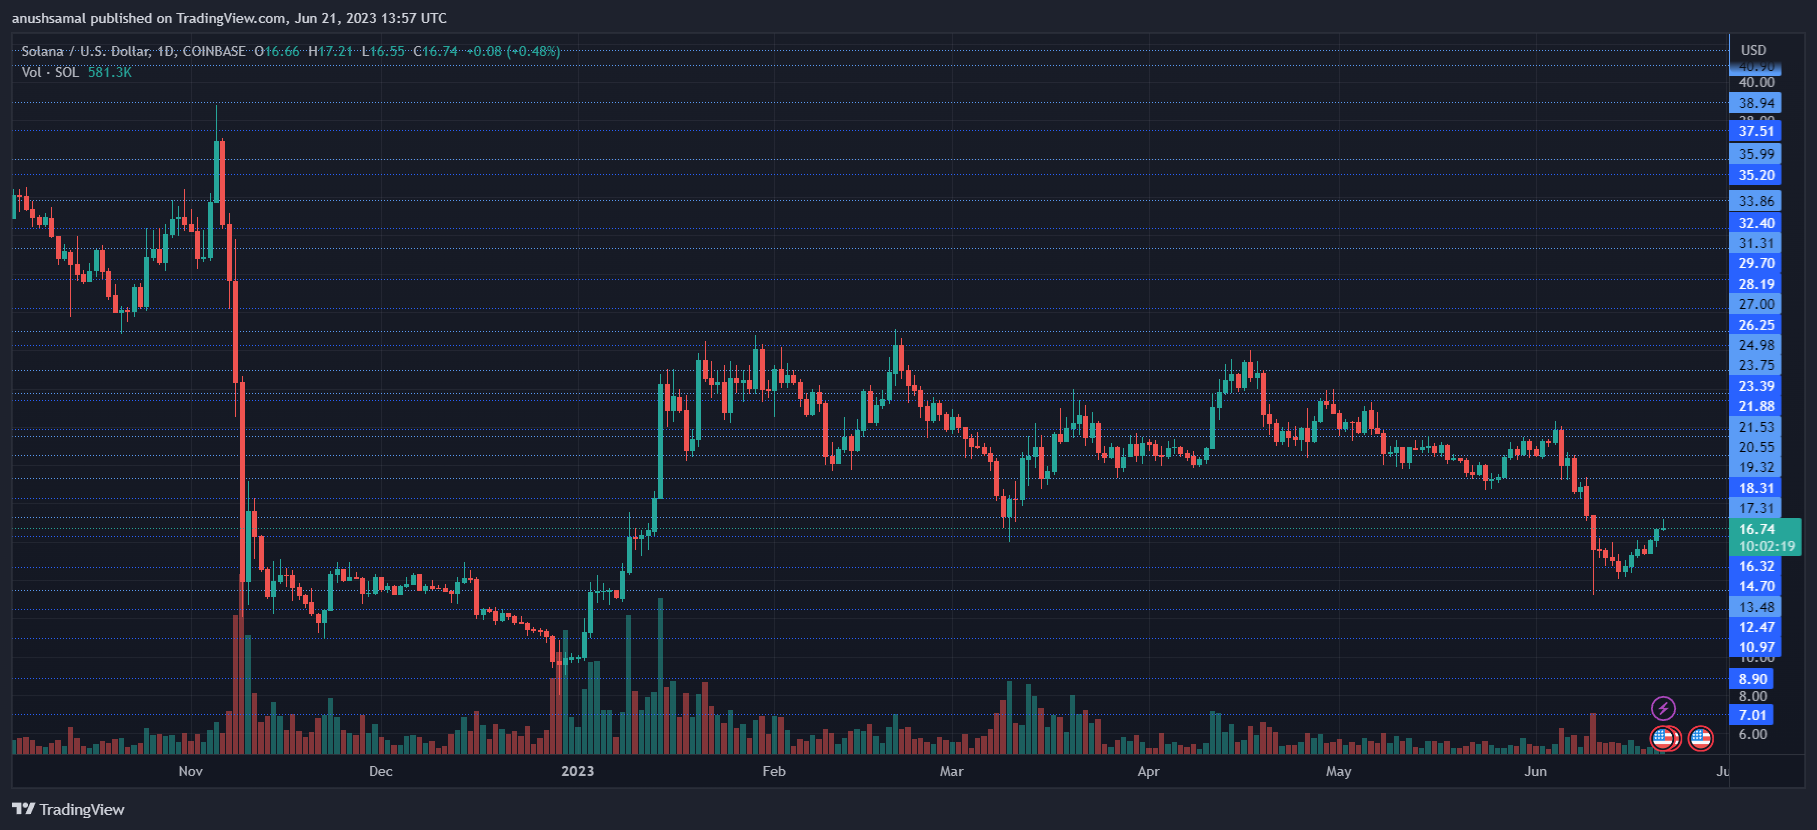
At the time of writing, SOL was trading at $16.74. The altcoin has rebounded from the price level of $14.40 and is currently showing a steady appreciation on its chart. However, in order for the bullish momentum to strengthen, SOL needs to surpass the immediate resistance level of $17.20.
If buyers fail to step in and drive the price higher, there is a possibility of a retracement in the chart. The local support level for SOL is situated at $15.21. If the coin is unable to sustain its position above this support level, it may further decline below $14.40.
Technical Analysis

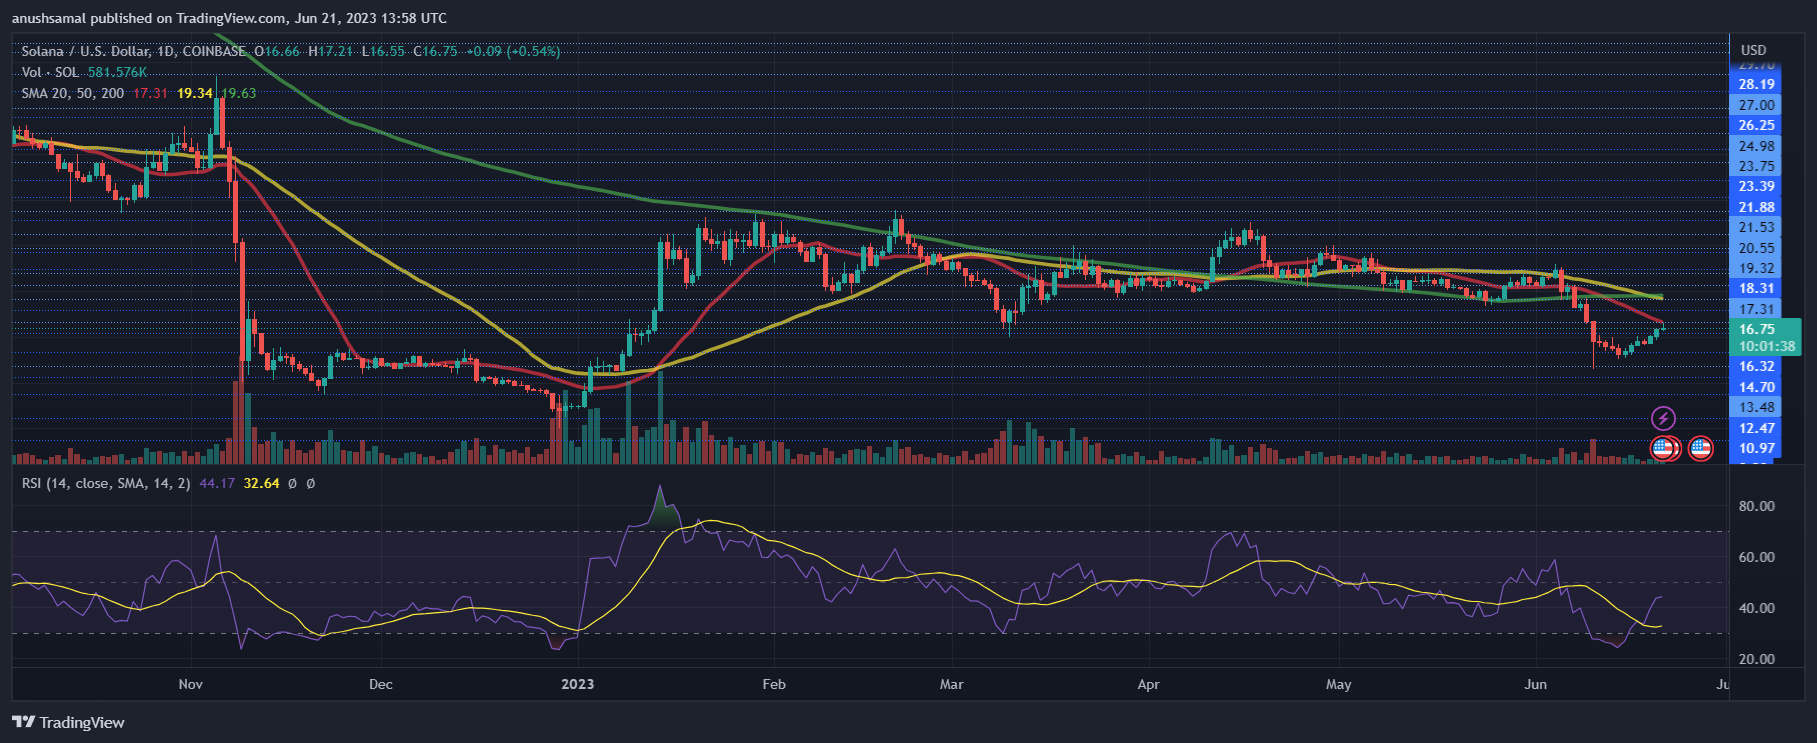
Although SOL has recovered from the oversold territory, the buying strength remains relatively weak despite a slight improvement. This is evident from the Relative Strength Index (RSI) being below the half-line, indicating that sellers maintain control over the price action.
Additionally, SOL has fallen below the 20-Simple Moving Average (SMA) line, suggesting that demand is still low and sellers are the driving force behind the market momentum.
For a more positive outlook, it is essential for SOL to successfully surpass the $17 price level. This breakthrough would potentially attract renewed demand to the market.

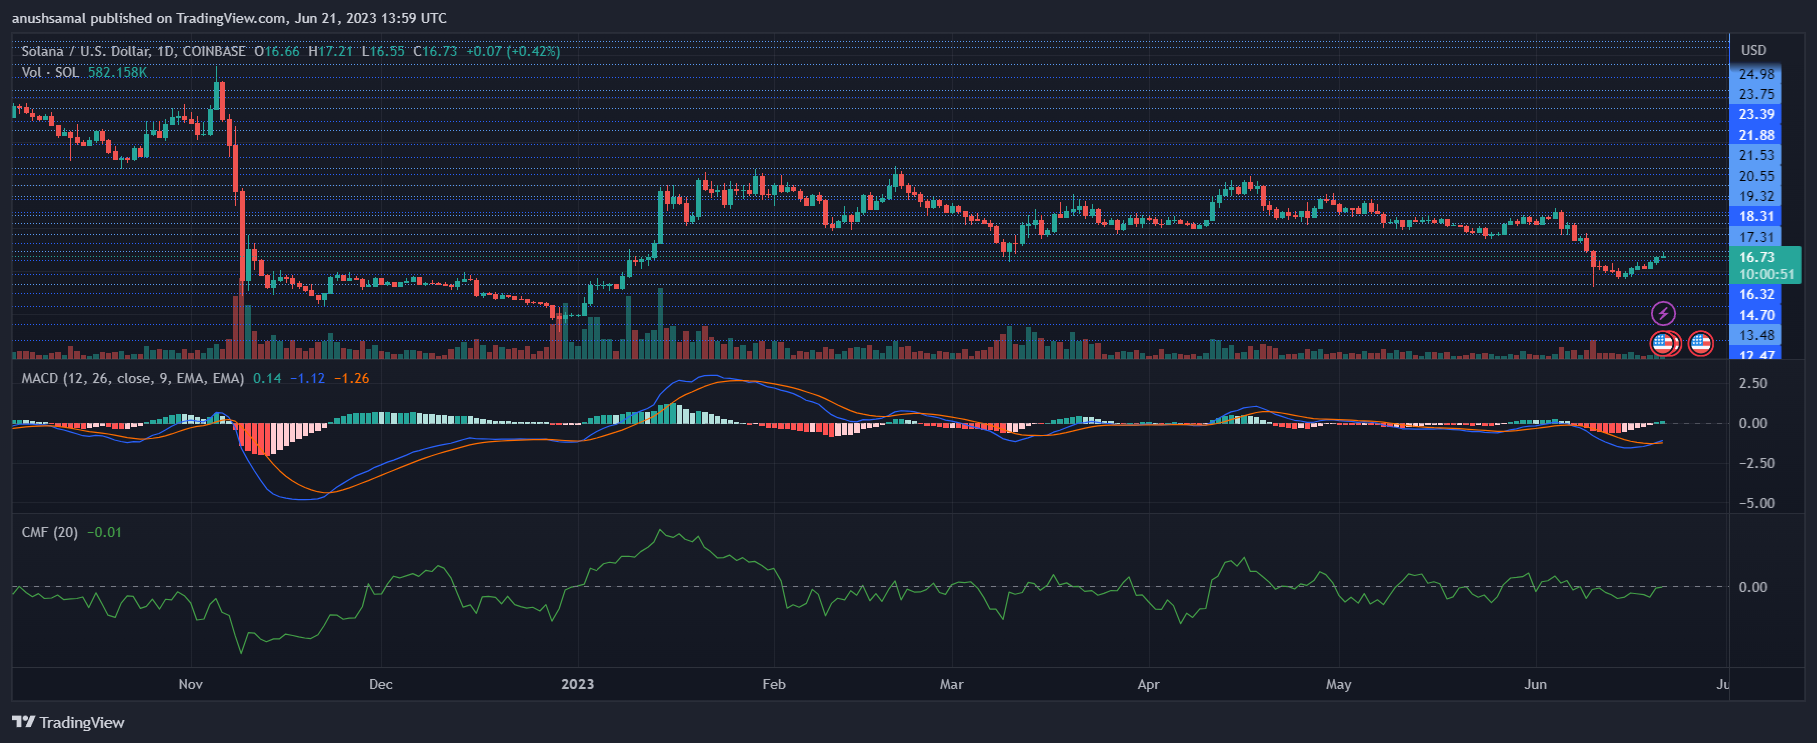
On the one-day chart, SOL has displayed mixed signals, including the emergence of buy signals. The Moving Average Convergence Divergence (MACD), which indicates momentum and potential shifts, has started forming green histograms associated with buy signals. This suggests the possibility of a positive price change for SOL in the future.
On the other hand, the Chaikin Money Flow (CMF), which depicts capital inflows and outflows, has remained below the half-line. This indicates that capital inflows have been relatively low on the chart, implying a lack of significant buying pressure for SOL.


