
Reason to trust
How Our News is Made
Strict editorial policy that focuses on accuracy, relevance, and impartiality
Ad discliamer
Morbi pretium leo et nisl aliquam mollis. Quisque arcu lorem, ultricies quis pellentesque nec, ullamcorper eu odio.
Solana rallied above the $60 resistance against the US Dollar. SOL price is up over 50% in a few days and might continue to rise toward the $75 level.
- SOL price started a major rally above the $55 resistance against the US Dollar.
- The price is now trading above $60 and the 100 simple moving average (4 hours).
- There is a major bullish trend line forming with support near $55.00 on the 4-hour chart of the SOL/USD pair (data source from Kraken).
- The pair could continue to move up if it clears the $68.00 resistance zone.
Solana Price Regains Strength
In the past few days, Solana saw a major rally above the $50 level. SOL gained bullish momentum after it settled above $50, outperforming Bitcoin and Ethereum.
The price is up over 50% in a few days and the bulls are not done yet. The recent move took the price above the $65 level. A high is formed near $67.21 and the price is now consolidating gains. It is showing positive signs above the 23.6% Fib retracement level of the upward move from the $51.23 swing low to the $67.21 high.
SOL is now trading above $60 and the 100 simple moving average (4 hours). There is also a major bullish trend line forming with support near $55.00 on the 4-hour chart of the SOL/USD pair.
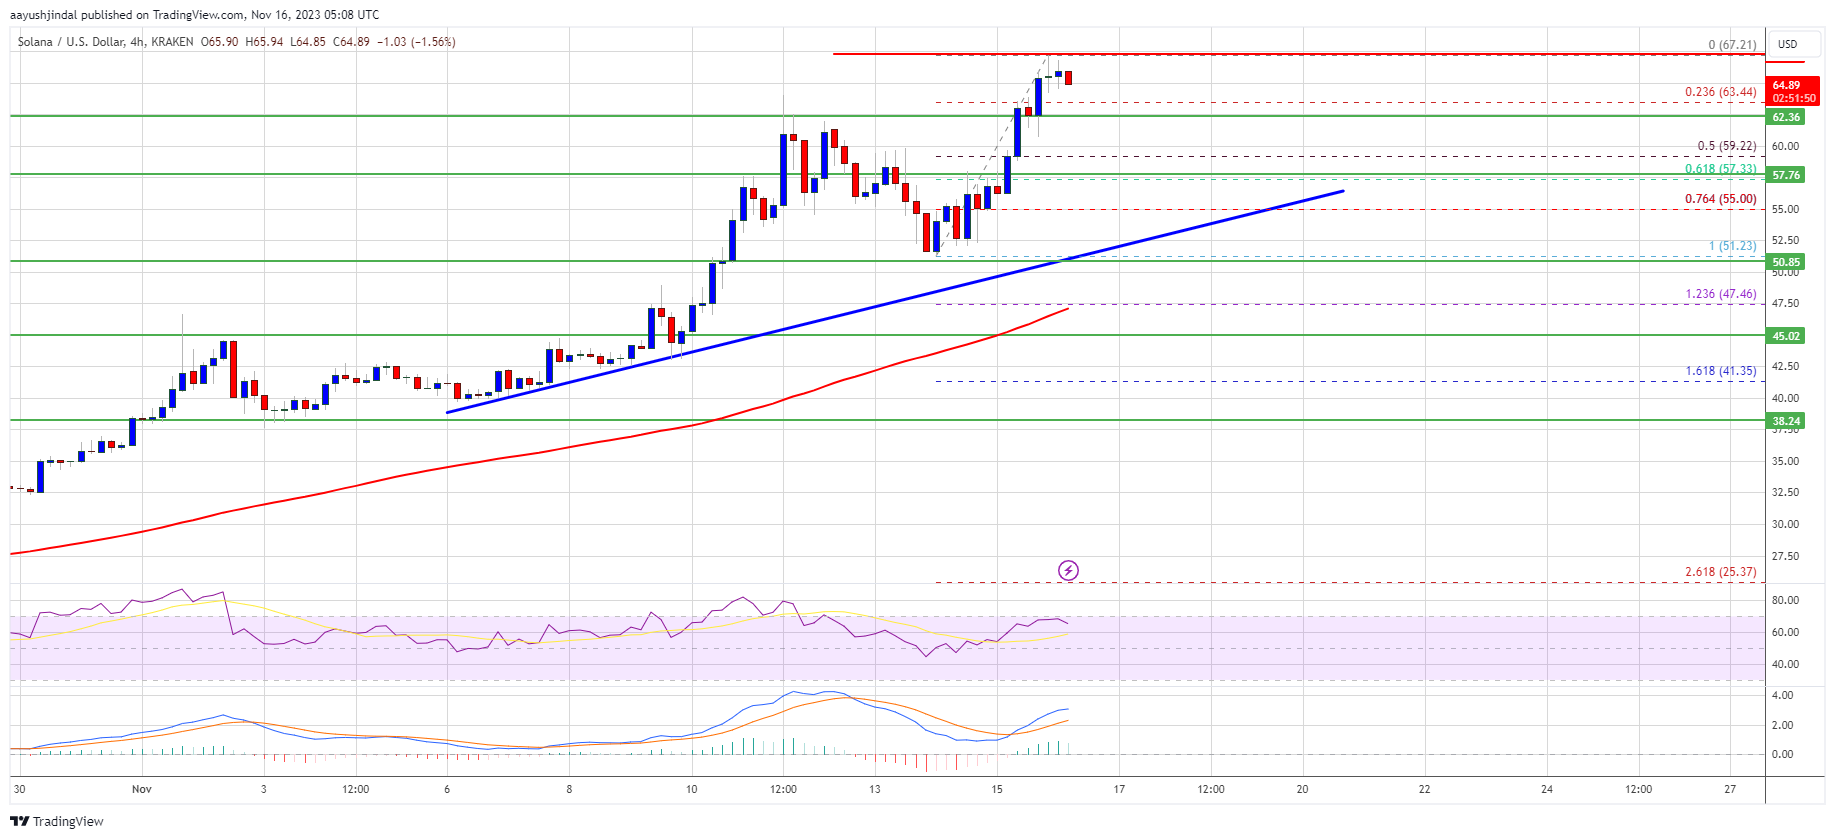
Source: SOLUSD on TradingView.com
On the upside, immediate resistance is near the $67.20 level. The first major resistance is near the $68.00 level. A successful close above the $65.00 resistance could set the pace for a larger increase. The next key resistance is near $70.00. Any more gains might send the price toward the $75.00 level.
Are Dips Supported in SOL?
If SOL fails to recover above the $68.00 resistance, it could start a downside correction. Initial support on the downside is near the $62.50 level.
The first major support is near the $57.75 level or the 61.8% Fib retracement level of the upward move from the $51.23 swing low to the $67.21 high, below which the price could test the trend line. If there is a close below the $55.00 support, the price could decline toward the $50.00 support in the near term.
Technical Indicators
4-Hours MACD – The MACD for SOL/USD is losing pace in the bullish zone.
4-Hours RSI (Relative Strength Index) – The RSI for SOL/USD is above the 50 level.
Major Support Levels – $62.50, and $57.75.
Major Resistance Levels – $68.00, $70.00, and $75.00.


