
Reason to trust
How Our News is Made
Strict editorial policy that focuses on accuracy, relevance, and impartiality
Ad discliamer
Morbi pretium leo et nisl aliquam mollis. Quisque arcu lorem, ultricies quis pellentesque nec, ullamcorper eu odio.
Solana is correcting gains from the $25 resistance against the US Dollar. SOL price could accelerate lower if there is a break below the $21 support.
- SOL price started a fresh decline after it failed to clear the $25 resistance against the US Dollar.
- The price is now trading below $22.00 and the 100 simple moving average (4 hours).
- There is a key bearish trend line forming with resistance near $22.00 on the 4-hour chart of the SOL/USD pair (data source from Kraken).
- The pair could break the $21 support and accelerate lower toward $18.80.
Solana Price Visits Key Support
After a steady increase, Solana struggled to clear the $25 resistance zone. SOL formed a high at $24.77 and recently started a fresh decline.
There was a move below the $24.00 and $23.50 levels. The bears pushed the price below the 50% Fib retracement level of the upward move from the $18.75 swing low to the $24.77 high. There is also a key bearish trend line forming with resistance near $22.00 on the 4-hour chart of the SOL/USD pair.
SOL is now trading below $22.00 and the 100 simple moving average (4 hours). It is also showing bearish signs below $22, like Bitcoin and Ethereum.
However, the bulls are now protecting the $21.00 support. It is near the 61.8% Fib retracement level of the upward move from the $18.75 swing low to the $24.77 high. On the upside, immediate resistance is near the $22.00 level and the trend line.
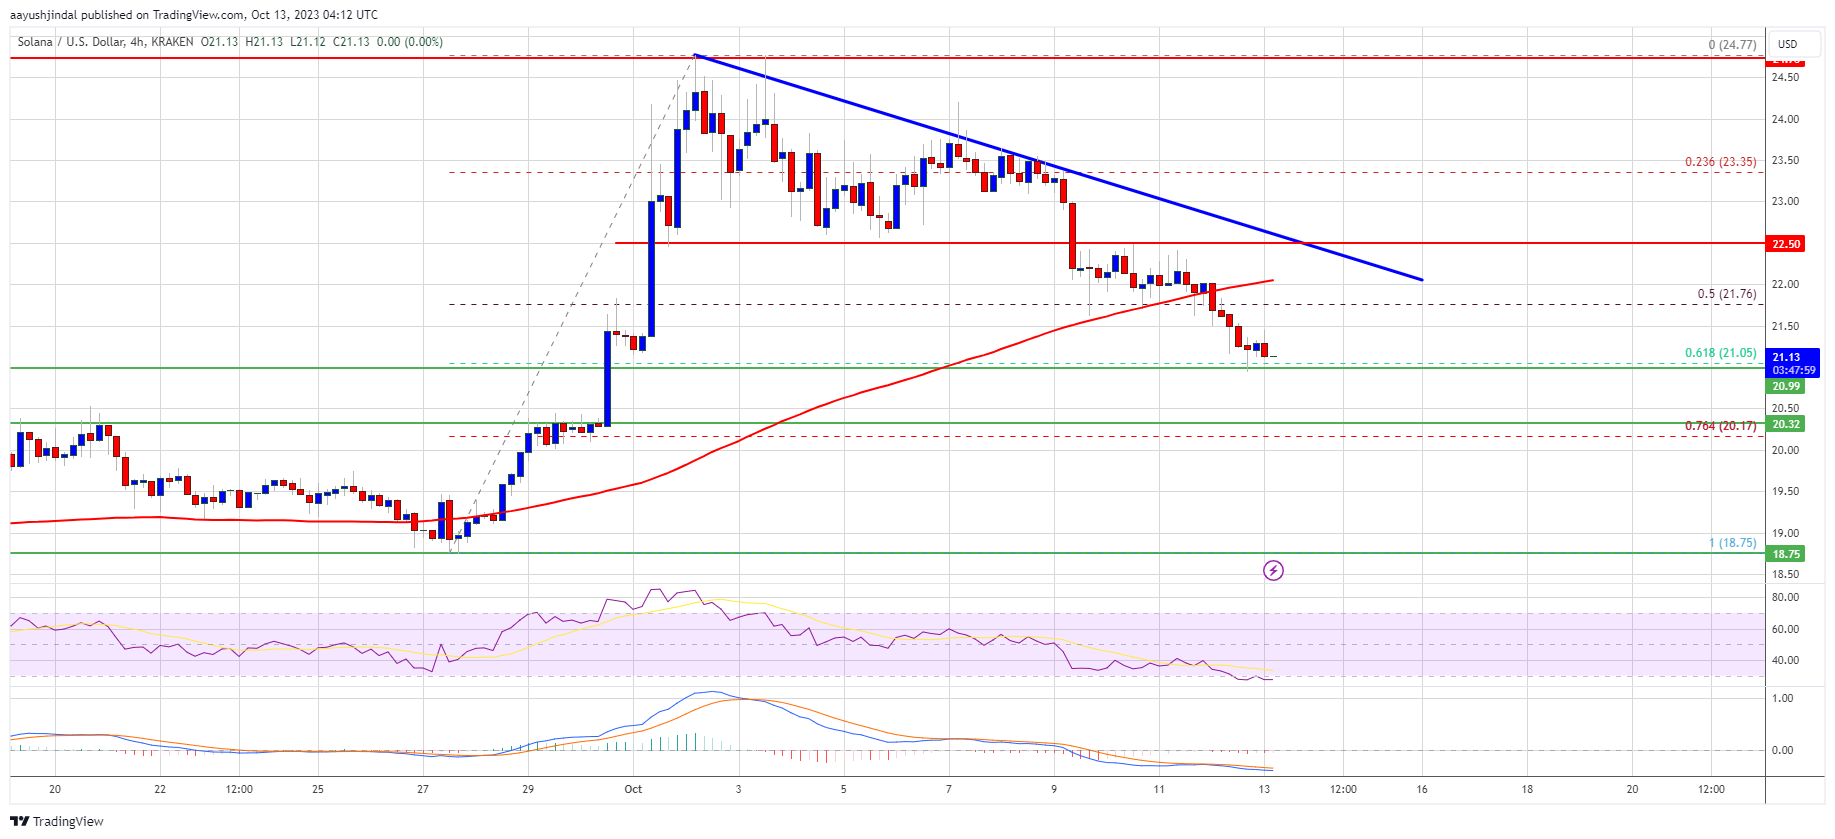
Source: SOLUSD on TradingView.com
The first major resistance is near the $22.50 level. A clear move above the $22.50 resistance might send the price toward the $23.50 resistance. The next key resistance is near $24.00. Any more gains might send the price toward the $25.00 level.
More Losses in SOL?
If SOL fails to recover above the $22.00 resistance, it could continue to move down. Initial support on the downside is near the $21.00 level.
The first major support is near the $20.30 level. If there is a close below the $20.00 support, the price could decline toward the $20.00 support. In the stated case, there is a risk of more downsides toward the $18.80 support in the near term.
Technical Indicators
4-Hours MACD – The MACD for SOL/USD is gaining pace in the bearish zone.
4-Hours RSI (Relative Strength Index) – The RSI for SOL/USD is below the 50 level.
Major Support Levels – $21.00, and $20.30.
Major Resistance Levels – $22.00, $22.50, and $24.00.


