
Reason to trust
How Our News is Made
Strict editorial policy that focuses on accuracy, relevance, and impartiality
Ad discliamer
Morbi pretium leo et nisl aliquam mollis. Quisque arcu lorem, ultricies quis pellentesque nec, ullamcorper eu odio.
Solana is eyeing a fresh increase above the $19.00 resistance against the US Dollar. SOL price must settle above $19 and $20 to start a fresh increase.
- SOL price is attempting a bullish breakout above the $19 resistance against the US Dollar.
- The price is now trading below $20 and the 100 simple moving average (4 hours).
- There is a major bearish trend line forming with resistance near $18.80 on the 4-hour chart of the SOL/USD pair (data source from Kraken).
- The pair could gain bullish momentum if it settles above the trend line and $20.
Solana Price Eyes Bullish Breakout
In the past few days, Solana’s price extended its decline below the $22 support. SOL even traded below the $20 level to move further into a bearish zone.
Finally, it tested the $17.40 zone. A low was formed near $17.37 and the price is now attempting a fresh increase, like Bitcoin and Ethereum. There was a move above the $18.50 resistance zone. The price even spiked above the 50% Fib retracement level of the downward move from the $20.60 swing high to the $17.37 low.
However, the bears are protecting a close above the $19 resistance. There is also a major bearish trend line forming with resistance near $18.80 on the 4-hour chart of the SOL/USD pair.
Solana is now trading below $20 and the 100 simple moving average (4 hours). On the upside, immediate resistance is near the $19.00 level. The first major resistance is near the $19.40 level or the 100 simple moving average (4 hours). It is close to the 61.8% Fib retracement level of the downward move from the $20.60 swing high to the $17.37 low.
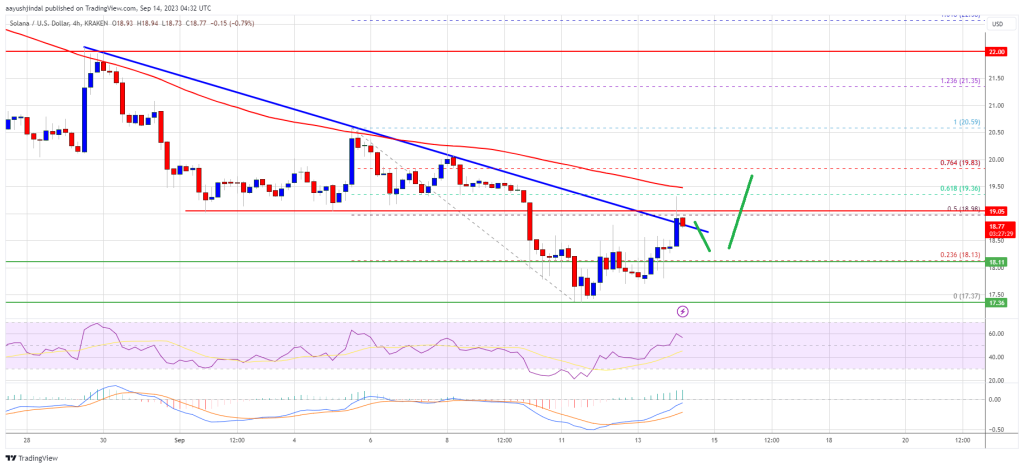
Source: SOLUSD on TradingView.com
The next key resistance is near $20. A clear move above the $20 resistance might send the price toward the $21.20 resistance. Any more gains might send the price toward the $22 level.
Another Decline in SOL?
If SOL fails to settle above $19.00 and $19.40, it could start another decline. Initial support on the downside is near the $18.10 level.
The first major support is near the $17.40 level. If there is a close below the $17.40 support, the price could decline toward the $16.50 support. In the stated case, there is a risk of more downsides toward the $15.00 support in the near term.
Technical Indicators
4-Hours MACD – The MACD for SOL/USD is gaining pace in the bullish zone.
4-Hours RSI (Relative Strength Index) – The RSI for SOL/USD is above the 50 level.
Major Support Levels – $18.10, and $17.40.
Major Resistance Levels – $19.00, $19.40, and $20.00.


