
Reason to trust
How Our News is Made
Strict editorial policy that focuses on accuracy, relevance, and impartiality
Ad discliamer
Morbi pretium leo et nisl aliquam mollis. Quisque arcu lorem, ultricies quis pellentesque nec, ullamcorper eu odio.
Ripple is resilient above the main $0.1920 support zone against the US Dollar. As long as XRP price is above $0.1900, it could drive the crypto market higher in the coming days.
- Ripple price is consolidating in a range above the $0.1920 and $0.1900 support levels against the US dollar.
- The price is stuck below the $0.2000 resistance and above the 100 simple moving average (4-hours).
- There is an important bullish flag forming with resistance near $0.2025 on the 4-hours chart of the XRP/USD pair (data source from Kraken).
- The pair is likely to start a fresh upward move as long as it is above the $0.1900 support.
Ripple Price Holding Uptrend Support
After a strong increase above $0.2000, ripple’s XRP failed to clear the $0.2120 resistance. It topped near the $0.2118 level and started a downside correction.
There was a break below the $0.2050 support level, but the price remained well above the 100 simple moving average (4-hours). The price even traded below the 23.6% Fib retracement level of the upward wave from the $0.1740 low to $0.2118 high.
However, the price is holding the main uptrend support at $0.1920. The 50% Fib retracement level of the upward wave from the $0.1740 low to $0.2118 high is also acting as a strong support.
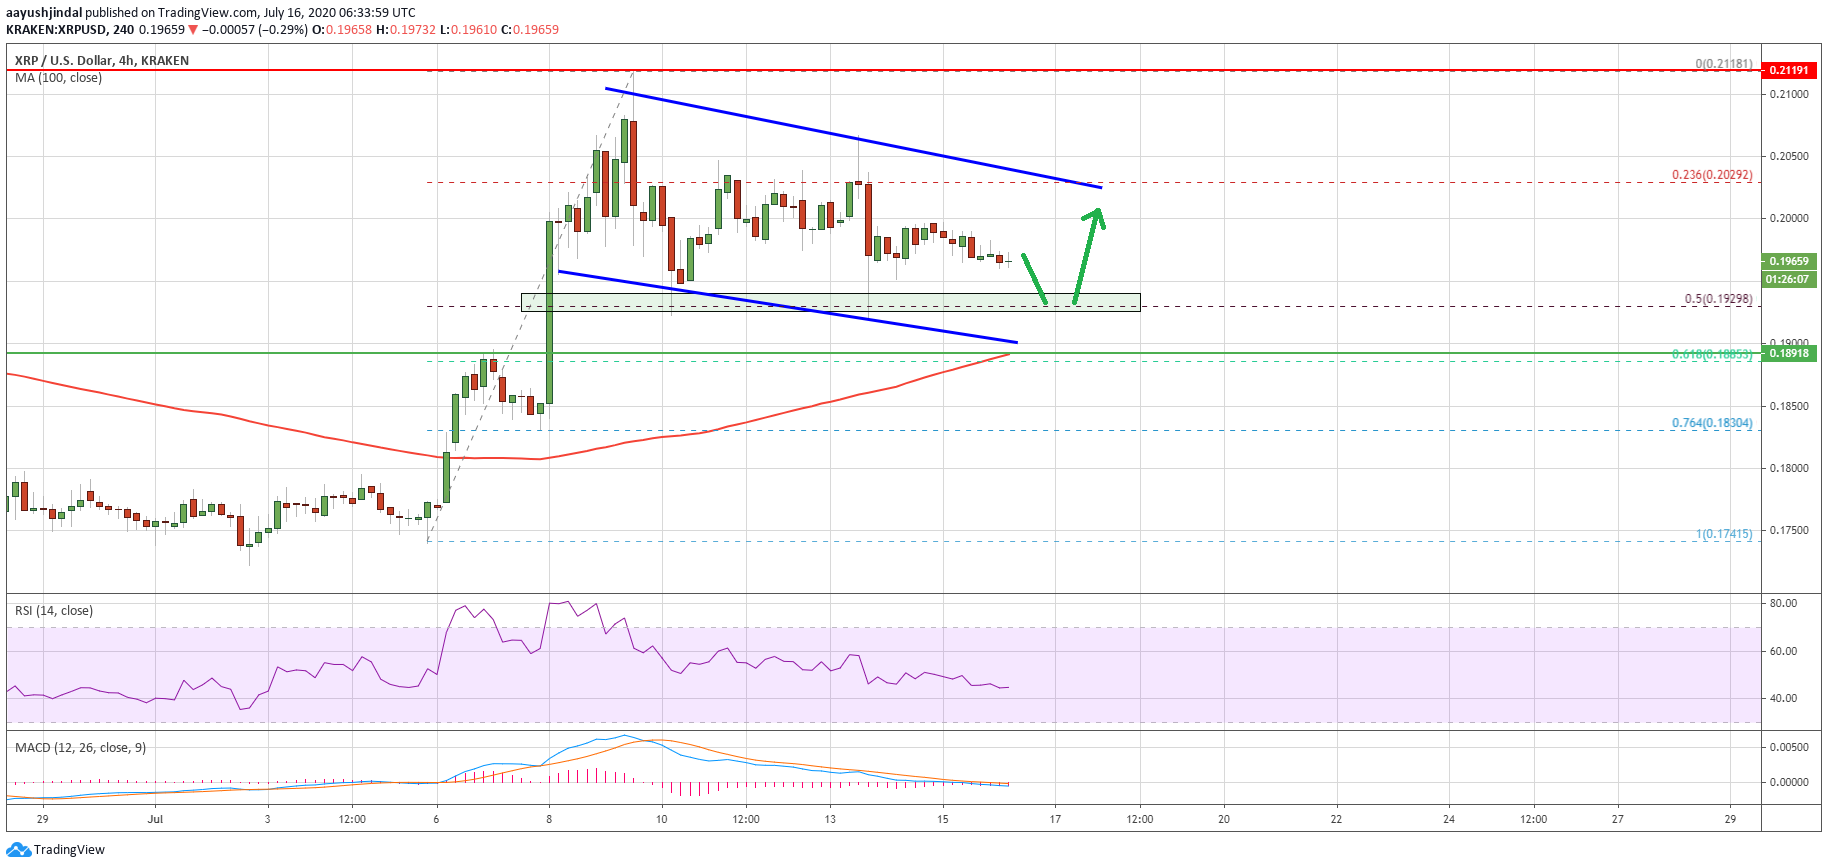
Ripple (XRP) price trades below $0.2000. Source: TradingView.com
It seems like there is an important bullish flag forming with resistance near $0.2025 on the 4-hours chart of the XRP/USD pair. On the upside, the price is facing hurdles near $0.2000, $0.2020 and $0.2025.
A successful close and a follow through above the channel resistance is needed for a fresh increase towards the $0.2100 level. If the bulls succeed, it could even drive bitcoin and ether higher in the coming sessions.
Downside Break in XRP
If XRP struggles to gain strength above $0.2000 and fails to clear the channel resistance, it could continue to move down.
The first major support is near the $0.1920 level. The crucial uptrend support is near the $0.1900 level and the 100 simple moving average (4-hours), below which the price might move into a bearish zone.
Technical Indicators
4-Hours MACD – The MACD for XRP/USD is slowly gaining strength in the bearish zone.
4-Hours RSI (Relative Strength Index) – The RSI for XRP/USD is currently sliding towards the 35 level.
Major Support Levels – $0.1920, $0.1900 and $0.1880.
Major Resistance Levels – $0.2000, $0.2025 and $0.2120.
Take advantage of the trading opportunities with Plus500
Risk disclaimer: 76.4% of retail CFD accounts lose money.


