
Reason to trust
How Our News is Made
Strict editorial policy that focuses on accuracy, relevance, and impartiality
Ad discliamer
Morbi pretium leo et nisl aliquam mollis. Quisque arcu lorem, ultricies quis pellentesque nec, ullamcorper eu odio.
Ripple is moving lower from the $0.405 resistance zone against the US Dollar. XRP price is now at a risk of downside break below the $0.37 support.
- Ripple is currently moving lower from the $0.4050 resistance zone against the US dollar.
- The price is now trading above $0.385 and the 100 simple moving average (4-hours).
- There is a key bearish trend line forming with resistance near $0.3780 on the 4-hours chart of the XRP/USD pair (data source from Kraken).
- The pair could recover if there is a clear move above the $0.385 and $0.388 resistance levels.
Ripple Price Dips Further
This past week, ripple’s XRP started a fresh decline from the $0.4050 resistance zone against the US Dollar. The price declined below the $0.395 and $0.392 levels to move into a bearish zone.
There was a drop below the $0.380 level and the 100 simple moving average (4-hours). A low is formed near $0.3694 and the price is now consolidating losses. There is a key bearish trend line forming with resistance near $0.3780 on the 4-hours chart of the XRP/USD pair.
XRP price is now trading above $0.385 and the 100 simple moving average (4-hours). On the upside, an initial resistance is near the $0.378 zone and the trend line. The trend line is near the 23.6% Fib retracement level of the downward move from the $0.4086 swing high to $0.3694 low.
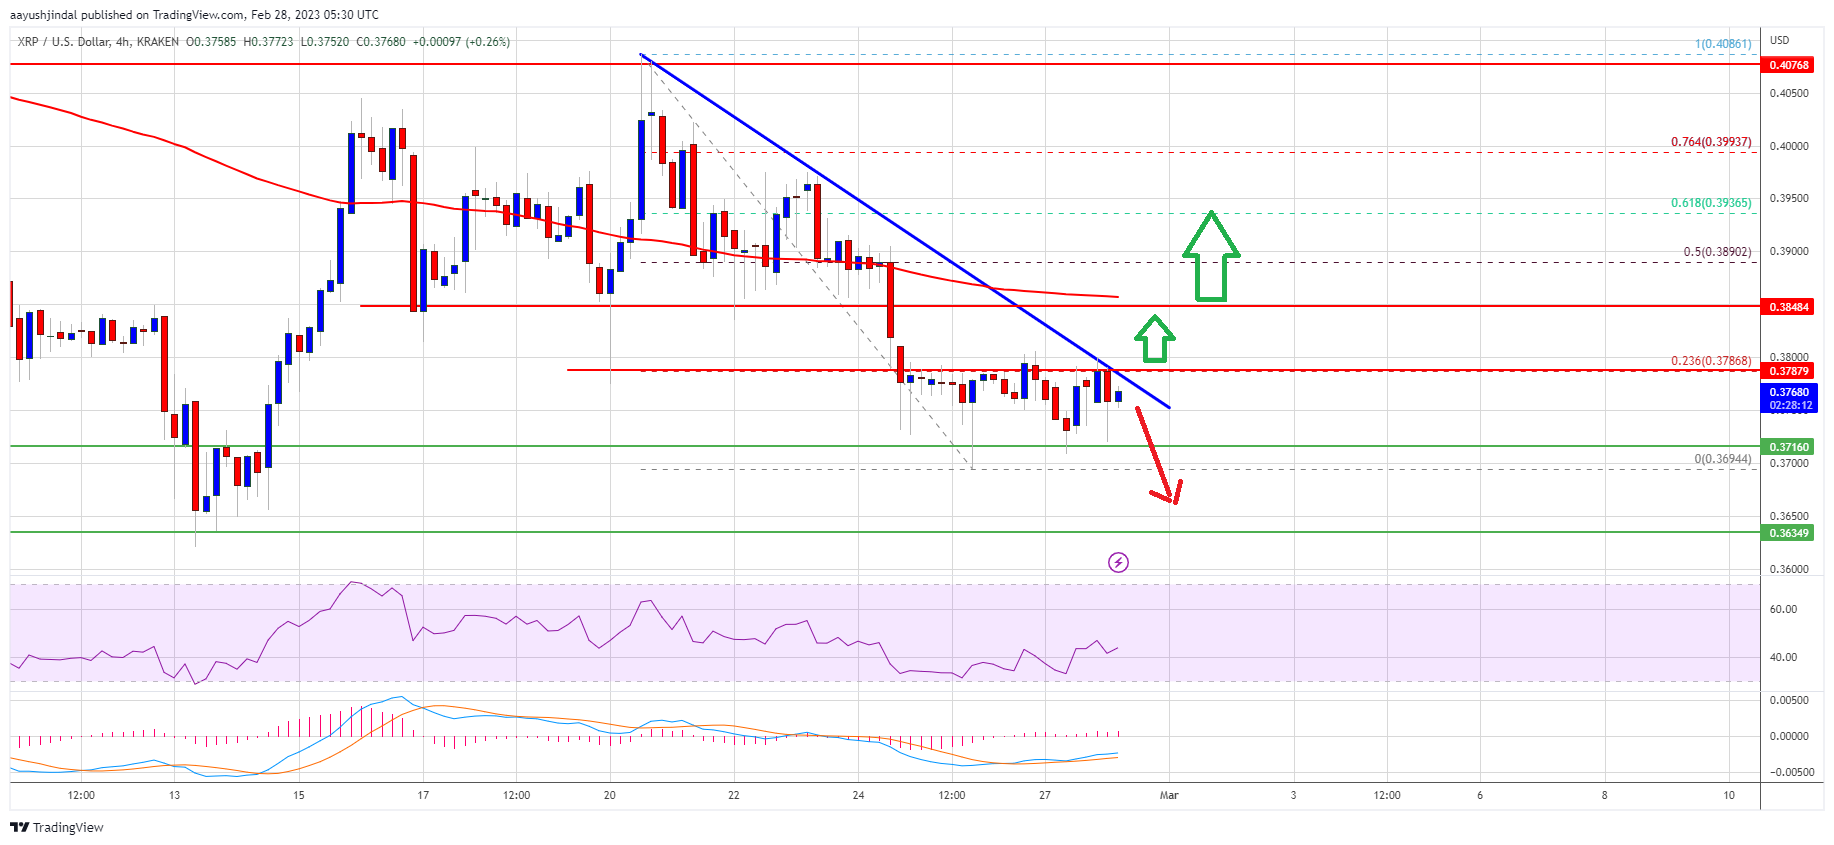
Source: XRPUSD on TradingView.com
The next key resistance is near the $0.3880 level or the 50% Fib retracement level of the downward move from the $0.4086 swing high to $0.3694 low. A successful break above the $0.388 resistance might send the price towards the $0.400 resistance. Any more gains might send the price towards the $0.425 level.
More Losses in XRP?
If ripple fails to clear the $0.388 resistance zone, it could continue to move down. An initial support on the downside is near the $0.370 level.
The next major support is near $0.364. If there is a downside break and close below the $0.364 level, xrp price could extend losses. In the stated case, the price could even decline below the $0.332 support.
Technical Indicators
4-Hours MACD – The MACD for XRP/USD is now losing pace in the bearish zone.
4-Hours RSI (Relative Strength Index) – The RSI for XRP/USD is now below the 50 level.
Major Support Levels – $0.370, $0.364 and $0.332.
Major Resistance Levels – $0.384, $0.388 and $0.400.


