Reason to trust
How Our News is Made
Strict editorial policy that focuses on accuracy, relevance, and impartiality
Ad discliamer
Morbi pretium leo et nisl aliquam mollis. Quisque arcu lorem, ultricies quis pellentesque nec, ullamcorper eu odio.
Ripple’s token price is correcting gains from $0.550 against the US Dollar. XRP price could start a fresh bullish wave unless there is a close below $0.50.
- Ripple’s token price is correcting gains from the 0.550 resistance against the US dollar.
- The price is now trading above $0.505 and the 100 simple moving average (4 hours).
- There is a key bullish trend line forming with support near $0.504 on the 4-hour chart of the XRP/USD pair (data source from Kraken).
- The pair might start a fresh increase if it stays above the $0.500 and $0.490 support levels.
Ripple’s Token Price Holds Key Support
In the last XRP price prediction, we discussed a decent increase against the US Dollar. The price remained well-bid above the $0.520 level and climbed further higher, like Bitcoin and Ethereum.
The price surpassed the $0.532 resistance and tested $0.550. A high was formed near $0.5493 and the price saw a downside correction. There was a move below $0.532 and $0.525. There was a break below the 50% Fib retracement level of the upward move from the $0.4907 swing low to the $0.5493 high.
However, XRP is still trading above $0.505 and the 100 simple moving average (4 hours). Besides, there is a key bullish trend line forming with support near $0.504 on the 4-hour chart of the XRP/USD pair.
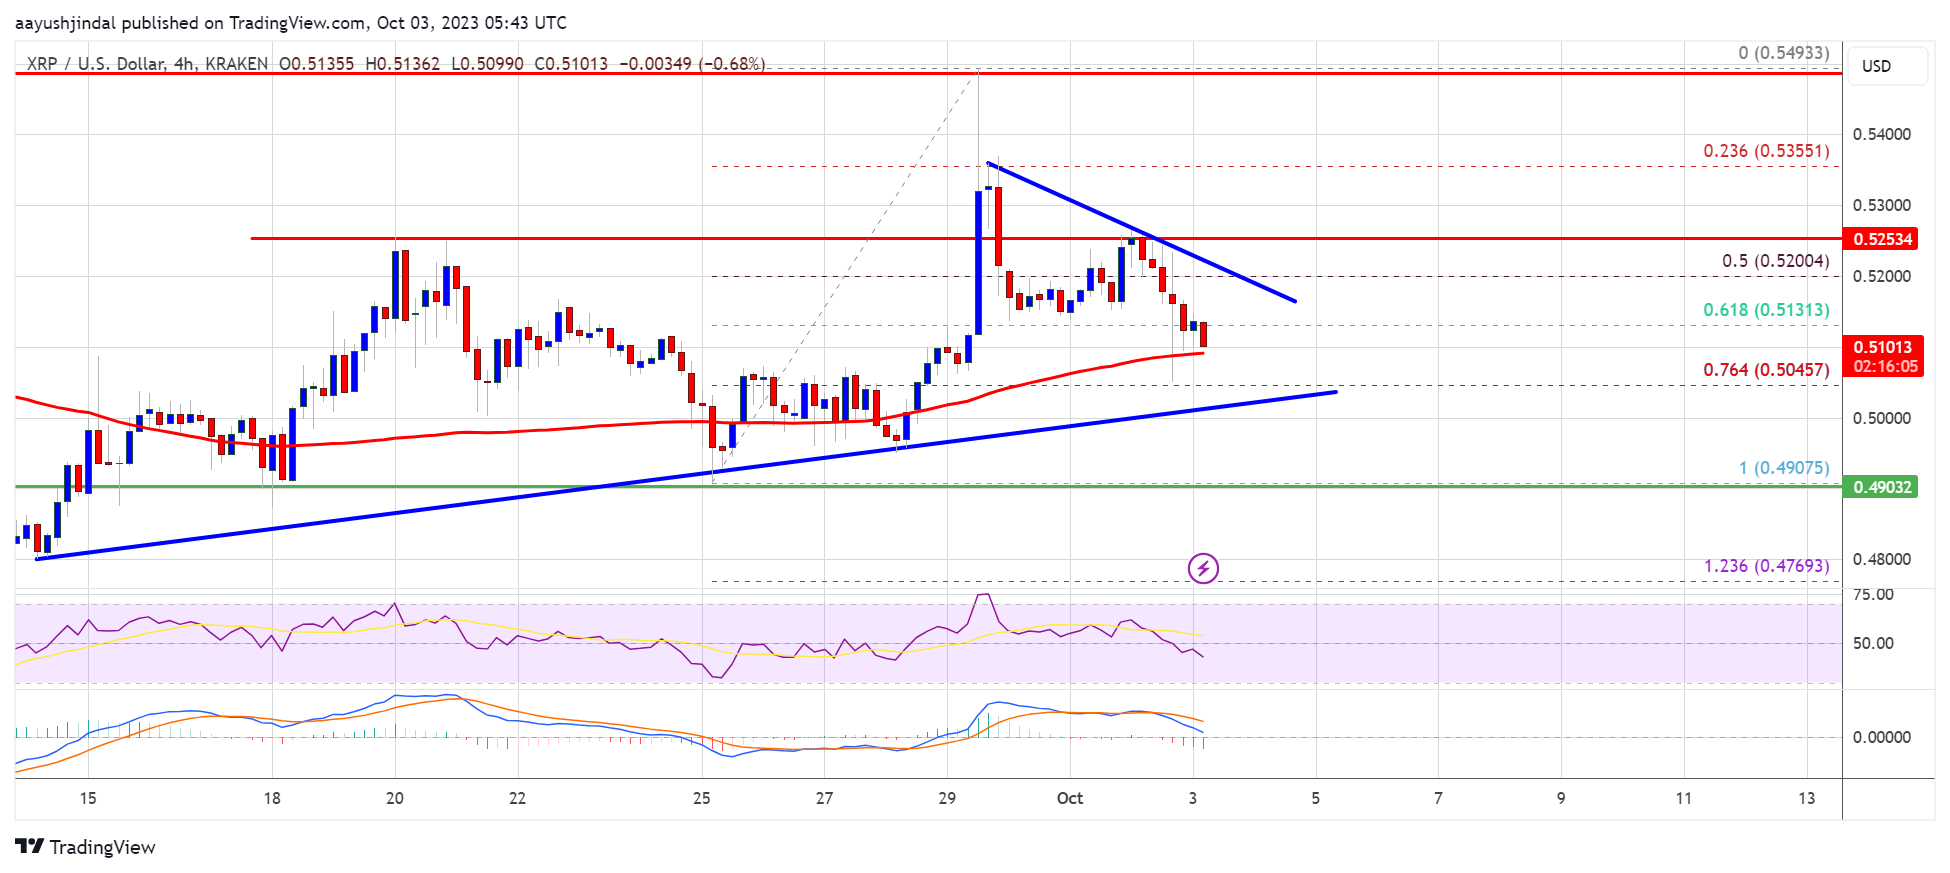
Source: XRPUSD on TradingView.com
On the upside, immediate resistance is near the $0.515 level. Besides, there is a connecting bearish trend line at $0.520. A close above the $0.520 level could send the price toward the $0.532 barrier. A successful break above the $0.532 resistance level might start a strong increase toward the $0.550 resistance. Any more gains might send XRP toward the $0.580 resistance.
More Losses in XRP?
If ripple fails to clear the $0.532 resistance zone, it could continue to move down. Initial support on the downside is near the $0.5065 zone and the 100 simple moving average (4 hours).
The next major support is at $0.500. If there is a downside break and a close below the $0.500 level, XRP’s price could extend losses. In the stated case, the price could retest the $0.475 support zone.
Technical Indicators
4-Hours MACD – The MACD for XRP/USD is now losing pace in the bullish zone.
4-Hours RSI (Relative Strength Index) – The RSI for XRP/USD is now below the 50 level.
Major Support Levels – $0.505, $0.500, and $0.490.
Major Resistance Levels – $0.520, $0.532, and $0.550.