Reason to trust
How Our News is Made
Strict editorial policy that focuses on accuracy, relevance, and impartiality
Ad discliamer
Morbi pretium leo et nisl aliquam mollis. Quisque arcu lorem, ultricies quis pellentesque nec, ullamcorper eu odio.
Ripple’s token price is showing bearish signs below $0.550 against the US Dollar. XRP price could start another decline if it trades below $0.500.
- Ripple’s token price is struggling to recover above $0.540 and $0.550 against the US dollar.
- The price is now trading below $0.550 and the 100 simple moving average (4 hours).
- There is a major bearish trend line forming with resistance near $0.540 on the 4-hour chart of the XRP/USD pair (data source from Kraken).
- The pair might start another decline if there is a break below $0.500.
Ripple’s Token Price Eyes Fresh Increase
After a sharp decline to $0.40, Ripple’s XRP started a recovery wave against the US Dollar. The price recovered above the $0.48 and $0.50 resistance levels, like Bitcoin and Ethereum.
The price was able to surpass the $0.520 resistance as well. Finally, there was a spike above the 50% Fib retracement level of the key drop from the $0.6655 swing high to the $0.3995 low. The bulls are now facing an uphill task near $0.550.
XRP is still trading below $0.540 and the 100 simple moving average (4 hours). There is also a major bearish trend line forming with resistance near $0.540 on the 4-hour chart of the XRP/USD pair.
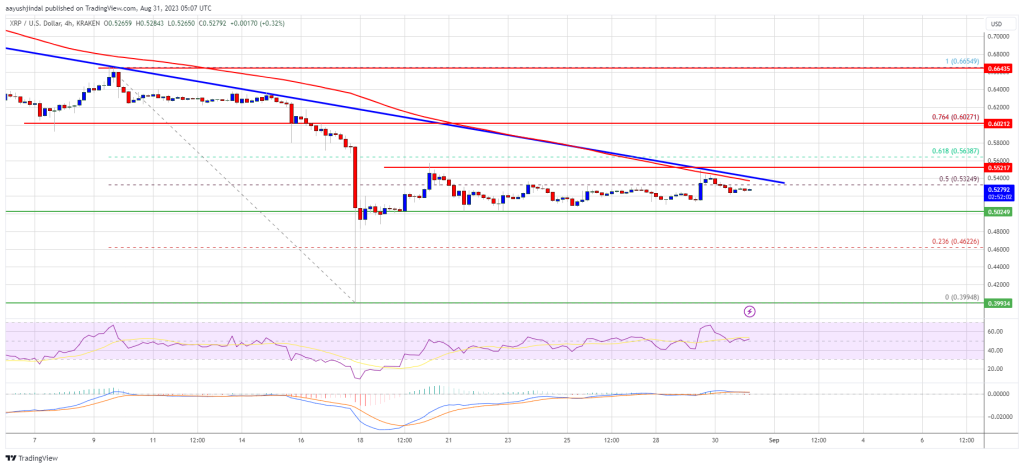
Source: XRPUSD on TradingView.com
Initial resistance on the upside is near the $0.540 zone and the trend line. The next major resistance is near the $0.550 level or the 61.8% Fib retracement level of the key drop from the $0.6655 swing high to the $0.3995 low. A successful break above the $0.550 resistance level might send the price toward the $0.60 resistance. Any more gains might call for a test of the $0.625 resistance.
Another Drop in XRP?
If ripple fails to clear the $0.550 resistance zone, it could start another decline. Initial support on the downside is near the $0.505 zone.
The next major support is at $0.500. If there is a downside break and a close below the $0.500 level, XRP’s price could extend losses. In the stated case, the price could retest the $0.435 support zone.
Technical Indicators
4-Hours MACD – The MACD for XRP/USD is now losing pace in the bullish zone.
4-Hours RSI (Relative Strength Index) – The RSI for XRP/USD is now above the 50 level.
Major Support Levels – $0.505, $0.500, and $0.435.
Major Resistance Levels – $0.540, $0.550, and $0.600.