Reason to trust
How Our News is Made
Strict editorial policy that focuses on accuracy, relevance, and impartiality
Ad discliamer
Morbi pretium leo et nisl aliquam mollis. Quisque arcu lorem, ultricies quis pellentesque nec, ullamcorper eu odio.
Ripple is moving higher above the $0.3850 resistance zone against the US Dollar. XRP price now eyes a clear move above the $0.400 resistance zone.
- Ripple is currently moving higher from the $0.3700 zone against the US dollar.
- The price is now trading above $0.385 and the 100 simple moving average (4-hours).
- There was a break above a key bearish trend line with resistance near $0.3740 on the 4-hours chart of the XRP/USD pair (data source from Kraken).
- The pair could rally if there is a close above the $0.400 and $0.405 resistance levels.
Ripple Price Climbs Higher
This past week, ripple’s XRP retested the key $0.3600 support zone against the US Dollar. The price remained well bid above the $0.3600 zone and recently started a fresh increase.
There was a clear move above the $0.3750 resistance zone. The price climbed nicely above the 50% Fib retracement level of the downward move from the $0.4086 swing high to $0.3596 low. Besides, there was a break above a key bearish trend line with resistance near $0.3740 on the 4-hours chart of the XRP/USD pair.
The price is now trading above $0.385 and the 100 simple moving average (4-hours), unlike bitcoin and ethereum. On the upside, an initial resistance is near the $0.3950 zone.
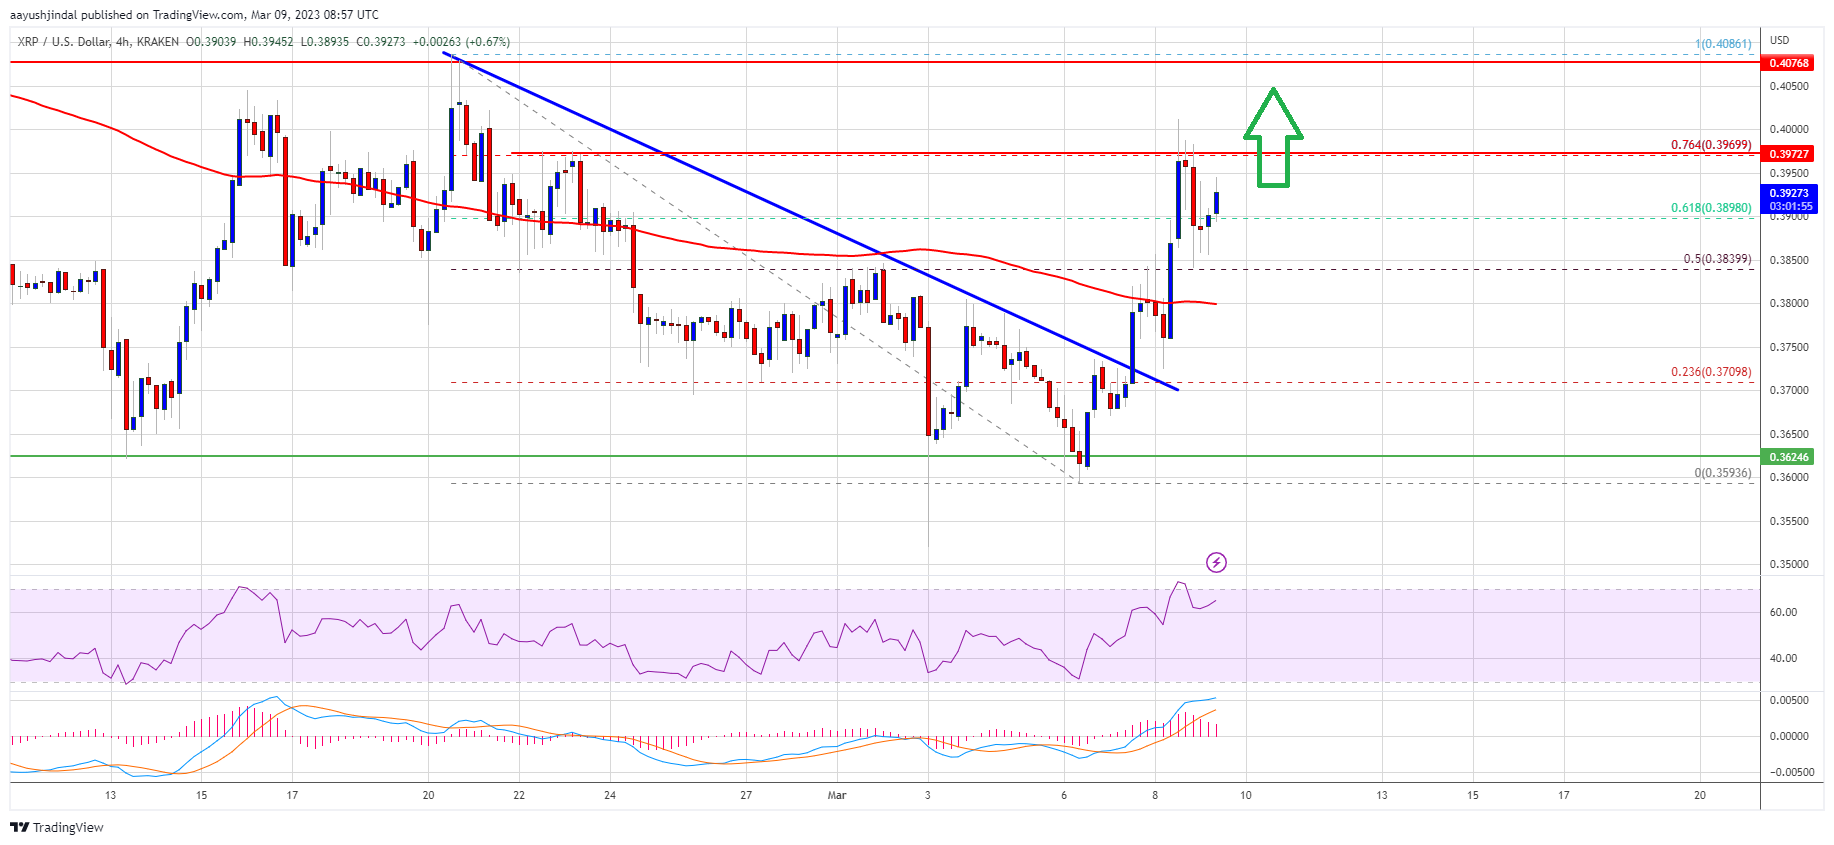
Source: XRPUSD on TradingView.com
The 76.4% Fib retracement level of the downward move from the $0.4086 swing high to $0.3596 low is also near the $0.3950 zone. The next key resistance is near the $0.400 level. A successful break above the $0.400 resistance might send the price towards the $0.408 resistance. Any more gains might send the price towards the $0.420 level.
Dips Limited in XRP?
If ripple fails to clear the $0.395 resistance zone, it could start a downside correction. An initial support on the downside is near the $0.385 level.
The next major support is near $0.380 and the 100 simple moving average (4-hours). If there is a downside break and close below the $0.380 level, xrp price could extend losses. In the stated case, the price could even decline below the $0.374 support and retest the $0.360 support.
Technical Indicators
4-Hours MACD – The MACD for XRP/USD is now losing pace in the bullish zone.
4-Hours RSI (Relative Strength Index) – The RSI for XRP/USD is now above the 50 level.
Major Support Levels – $0.385, $0.380 and $0.374.
Major Resistance Levels – $0.395, $0.400 and $0.408.