Reason to trust
How Our News is Made
Strict editorial policy that focuses on accuracy, relevance, and impartiality
Ad discliamer
Morbi pretium leo et nisl aliquam mollis. Quisque arcu lorem, ultricies quis pellentesque nec, ullamcorper eu odio.
Ripple is struggling to stay above the $0.42 resistance zone against the US Dollar. XRP price could decline heavily if there is a close below $0.38.
- Ripple is currently moving lower from the $0.42 resistance zone against the US dollar.
- The price is now trading below $0.40 and the 100 simple moving average (4-hours).
- There is a key bearish trend line forming with resistance near $0.4110 on the 4-hours chart of the XRP/USD pair (data source from Kraken).
- The pair could decline heavily if there is a close below the $0.38 support zone.
Ripple Price Revisits Support
This past week, ripple’s XRP made another attempt to clear the $0.42 resistance against the US Dollar. The price failed to gain strength and struggled to clear $0.42. A high was formed near $0.4204 and the price started a fresh decline.
There was a move below the $0.4120 support to move into a short-term bearish zone, similar to bitcoin and ethereum. The price even tested the key $0.3860 support zone.
A low is formed near $0.3861 and xrp price is now consolidating losses. It is trading below $0.40 and the 100 simple moving average (4-hours). An immediate resistance is near the $0.4040 zone. It is close to the 50% Fib retracement level of the recent decline from the $0.4204 swing high to $0.3861 low.
The next key resistance is near the $0.412 level. There is also a key bearish trend line forming with resistance near $0.4110 on the 4-hours chart of the XRP/USD pair.
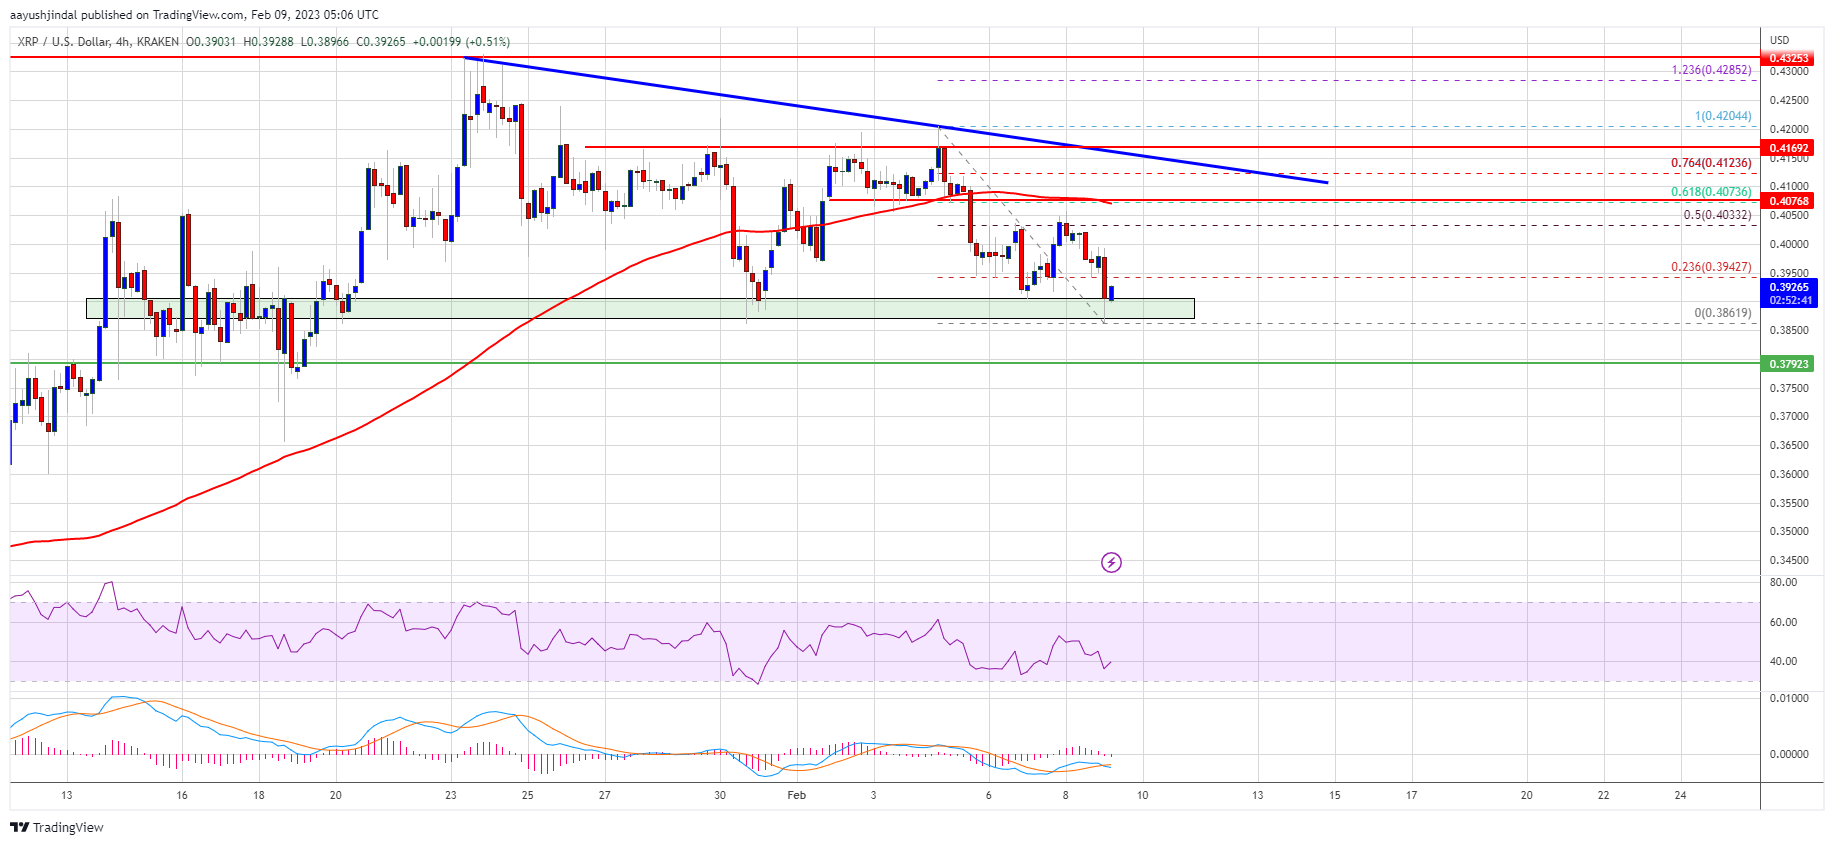
Source: XRPUSD on TradingView.com
The trend line is close to the 61.8% Fib retracement level of the recent decline from the $0.4204 swing high to $0.3861 low. A successful break above the $0.412 resistance might send the price towards the $0.420 resistance. Any more gains might send the price towards the $0.45 level.
Downside Break in XRP?
If ripple fails to clear the $0.412 resistance zone, it could continue to move down. An initial support on the downside is near the $0.3860 level.
The next major support is near $0.380. If there is a downside break and close below the $0.380 level, xrp price could extend losses. In the stated case, the price could even decline below the $0.350 support.
Technical Indicators
4-Hours MACD – The MACD for XRP/USD is now gaining pace in the bearish zone.
4-Hours RSI (Relative Strength Index) – The RSI for XRP/USD is now below the 50 level.
Major Support Levels – $0.386, $0.380 and $0.350.
Major Resistance Levels – $0.412, $0.420 and $0.450.