Reason to trust
How Our News is Made
Strict editorial policy that focuses on accuracy, relevance, and impartiality
Ad discliamer
Morbi pretium leo et nisl aliquam mollis. Quisque arcu lorem, ultricies quis pellentesque nec, ullamcorper eu odio.
Ripple is up over 15% and it broke the $0.5500 resistance against the US Dollar. XRP price is likely to continue higher towards $0.5800 and $0.6000 levels in the near term.
- Ripple started a fresh increase after it broke the $0.5000 resistance against the US dollar.
- The price is trading nicely above the $0.5200 level and the 100 simple moving average (4-hours).
- There is a key bullish trend line forming with support near $0.4900 on the 4-hours chart of the XRP/USD pair (data source from Kraken).
- The pair could continue to rise towards $0.6000 unless it fails to stay above $0.4500.
Ripple’s XRP Price is Rising Steadily
After forming a base above $0.3500, ripple’s XRP price started a steady increase. The price cleared a few important hurdles near $0.4000 and $0.4200 to move into a bullish zone.
Recently, the price cleared the $0.5000 resistance level. It is now trading nicely above the $0.5200 level and the 100 simple moving average (4-hours). There is also a key bullish trend line forming with support near $0.4900 on the 4-hours chart of the XRP/USD pair.
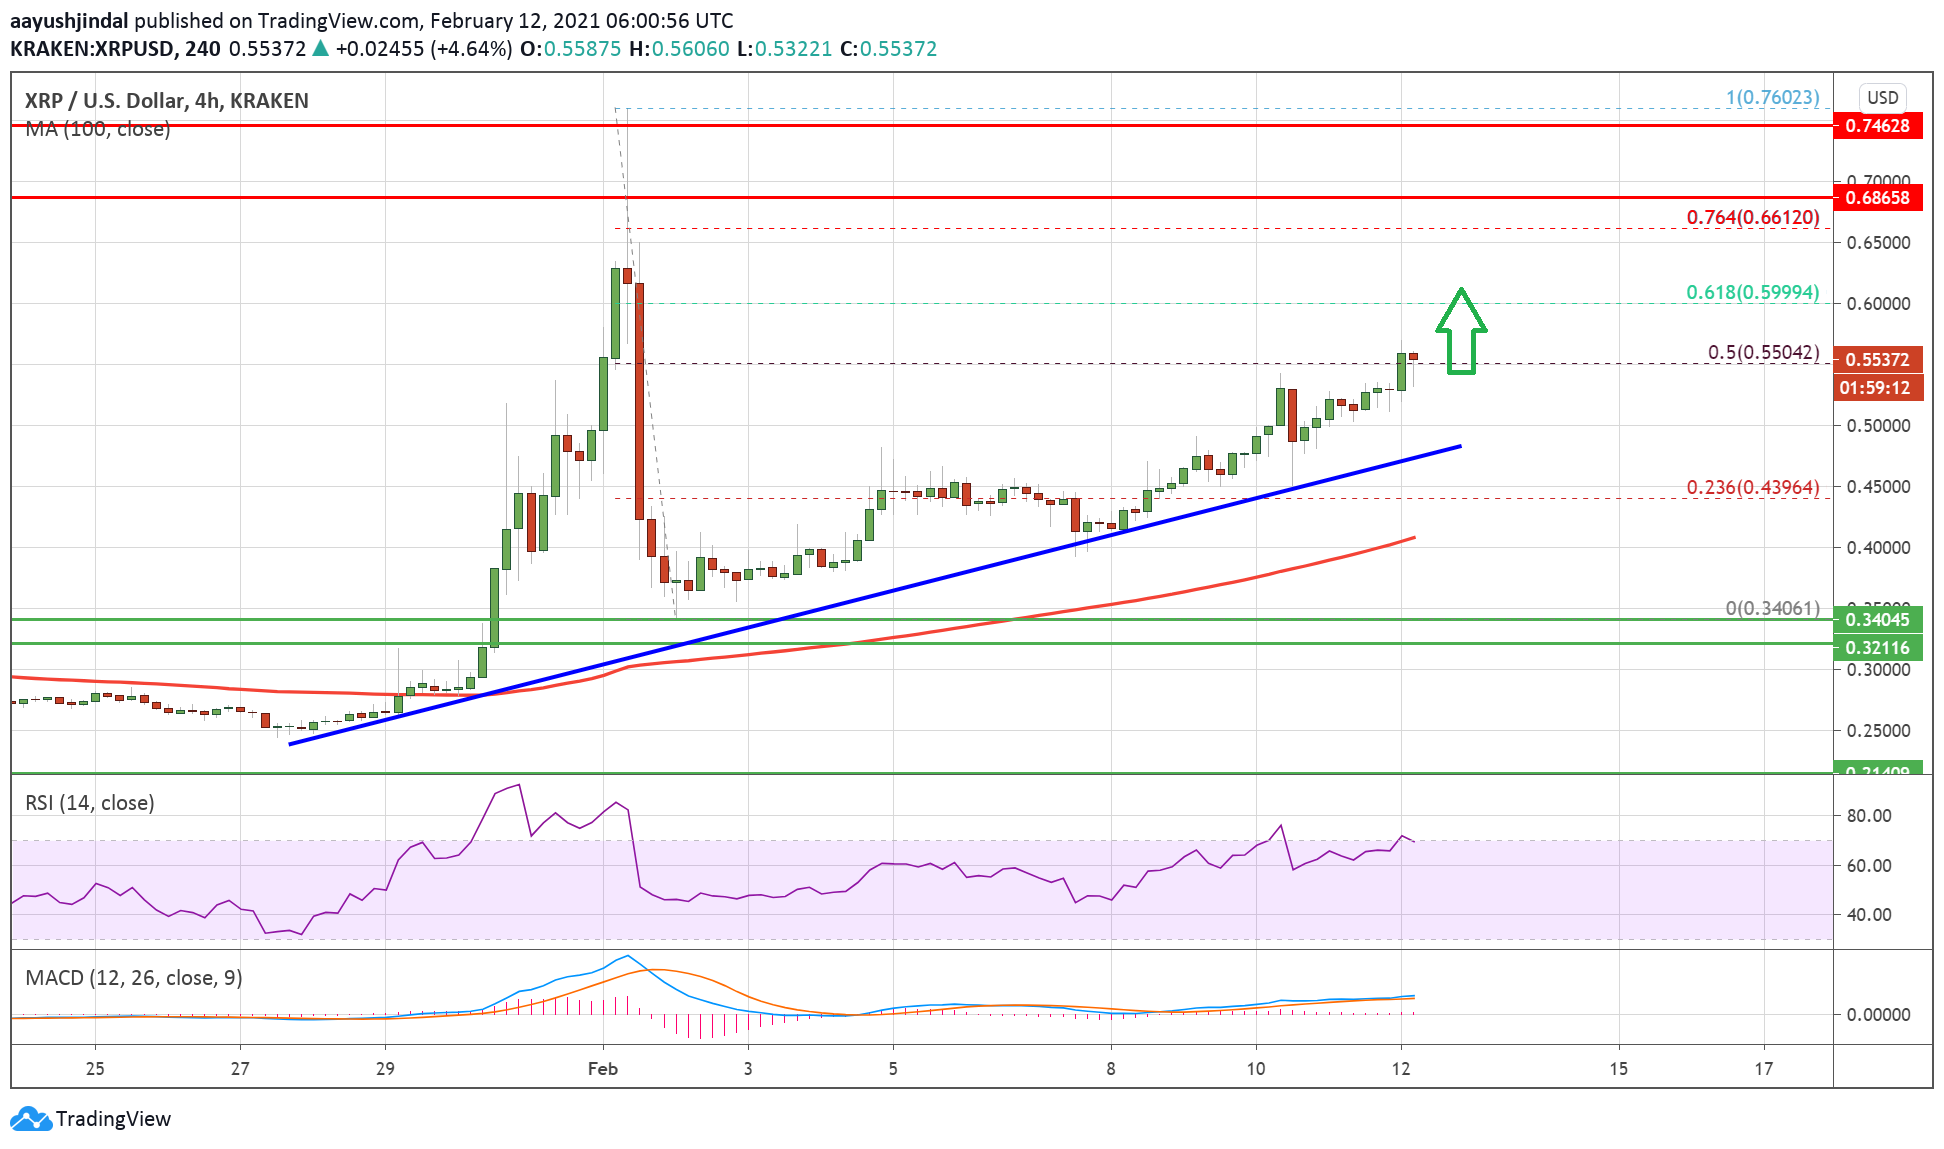
It is testing the 50% Fib retracement level of the key decline from the $0.7600 swing high to $0.3400 swing low. If there is a close above $0.5650, the price is likely to clear the $0.5800 resistance zone.
The next major resistance is sitting near the $0.6000 level. It is close to the 61.8% Fib retracement level of the key decline from the $0.7600 swing high to $0.3400 swing low. Any more gains might lead the price towards the $0.6700 high in the near term.
Dips Supported in XRP?
If ripple fails to climb above the $0.5800 resistance, there could be a short-term downside correction. An initial support on the downside is near the $0.5200 level.
The next major support is near the $0.5000 level and the trend line. A downside break below the trend line support could open the doors for a push towards the $0.4200 support. The main support is now forming near the $0.4000 level and the 100 simple moving average (4-hours).
Technical Indicators
4-Hours MACD – The MACD for XRP/USD is gaining pace in the bullish zone.
4-Hours RSI (Relative Strength Index) – The RSI for XRP/USD is now well above the 50 level.
Major Support Levels – $0.5200, $0.5000 and $0.4000.
Major Resistance Levels – $0.5800, $0.6000 and $0.6700.