Reason to trust
How Our News is Made
Strict editorial policy that focuses on accuracy, relevance, and impartiality
Ad discliamer
Morbi pretium leo et nisl aliquam mollis. Quisque arcu lorem, ultricies quis pellentesque nec, ullamcorper eu odio.
Ripple started a fresh increase after testing $1.00 against the US Dollar. XRP price is likely to surge further if it clears the $1.45 and $1.46 resistance levels.
- Ripple is showing positive signs above the $1.25 and $1.30 resistance levels against the US dollar.
- The price is now trading well above $1.3200 and testing the 100 simple moving average (4-hours).
- There was a break above a major bearish trend line with resistance near $1.15 on the 4-hours chart of the XRP/USD pair (data source from Kraken).
- The pair is likely to start another rally if it clears the $1.45 resistance zone.
Ripple’s XRP Price Eyes More Upsides
This past week, ripple’s XRP found a strong buying interest near the $1.00 zone. XRP formed a support base above $1.00 and started a fresh increase, similar to bitcoin and ethereum.
The price broke many important hurdles near the $1.10 level. There was a break above a major bearish trend line with resistance near $1.15 on the 4-hours chart of the XRP/USD pair. The pair cleared the 23.6% Fib retracement level of the downward move from the $1.97 high to $0.94 swing low.
It is now trading well above $1.3200 and testing the 100 simple moving average (4-hours). XRP is now consolidating near a major hurdle at $1.45.
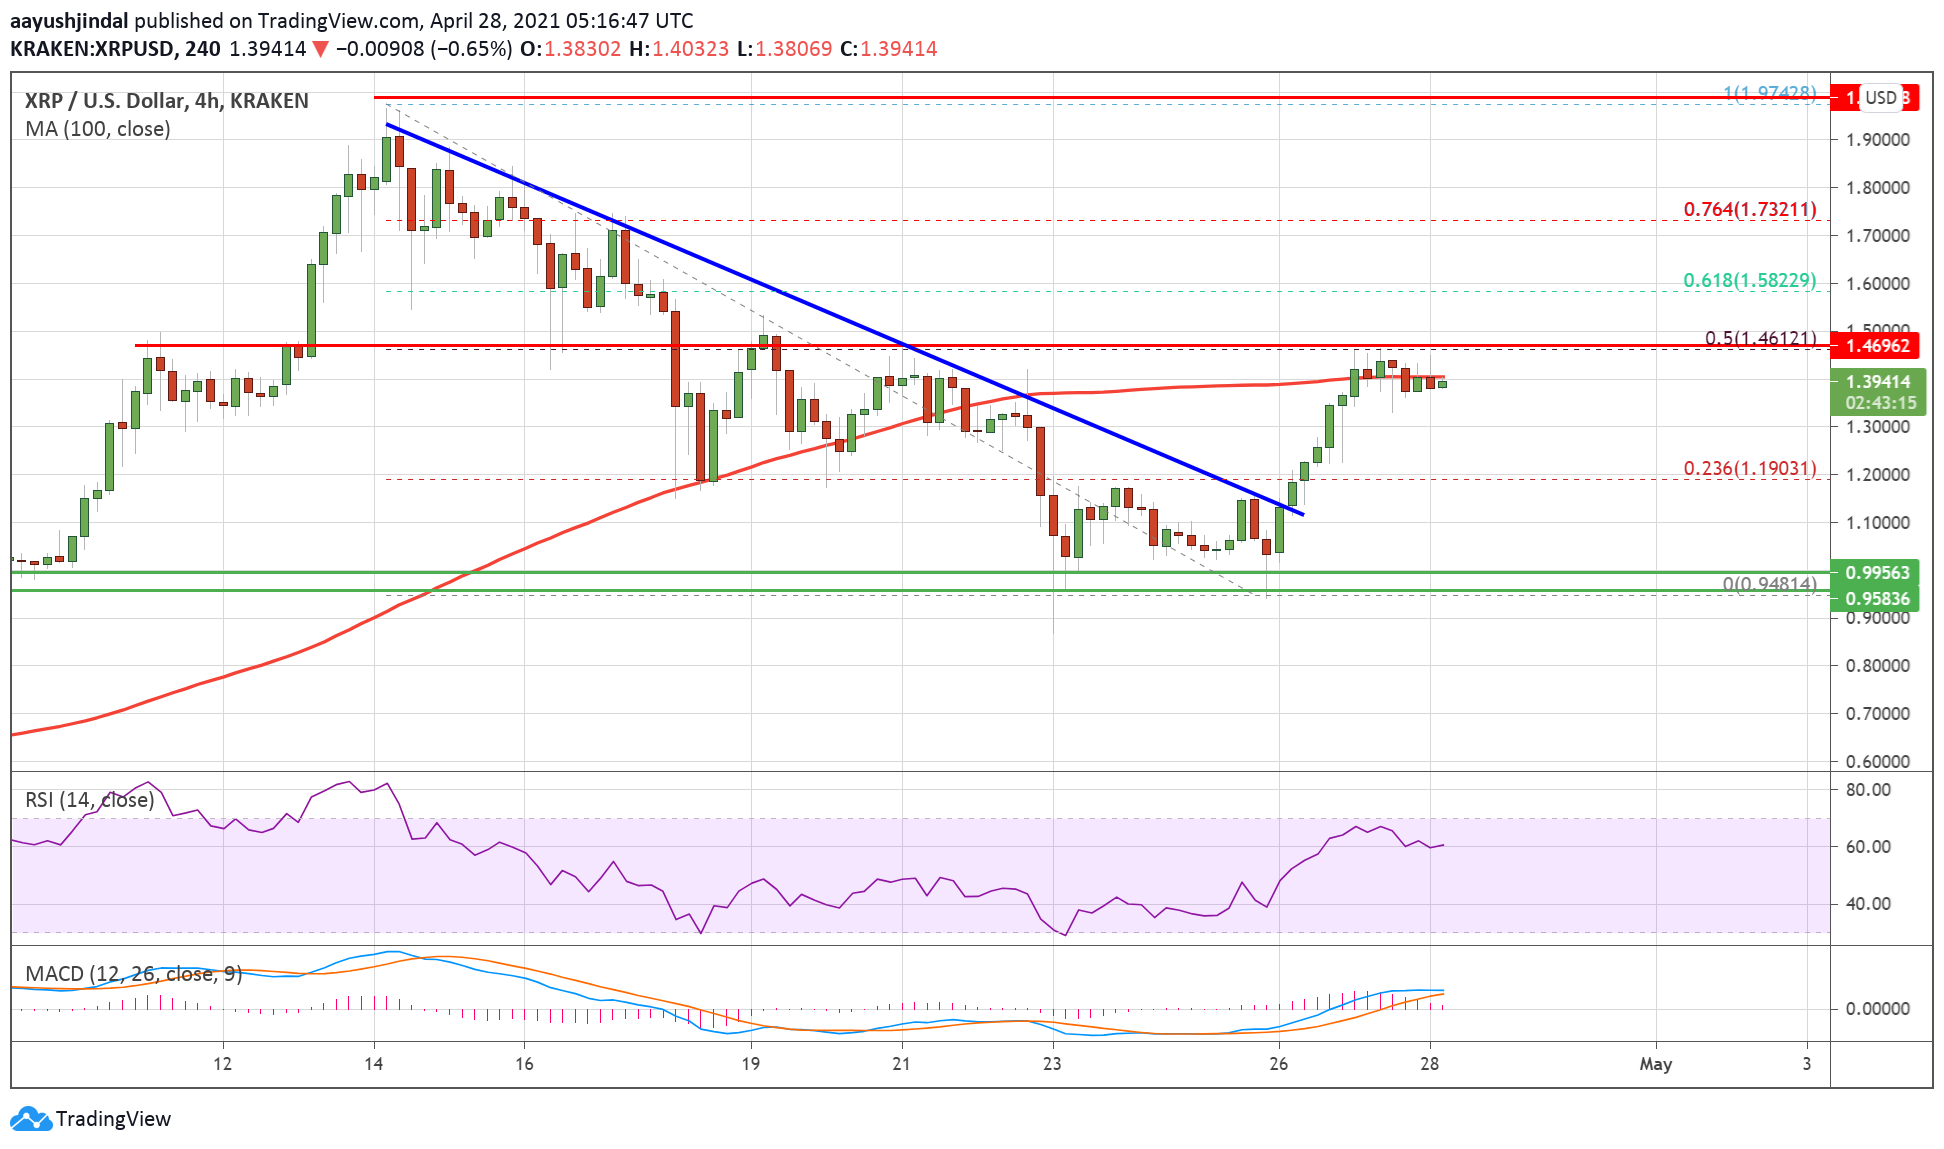
Source: XRPUSD on TradingView.com
The 50% Fib retracement level of the downward move from the $1.97 high to $0.94 swing low is acting as major barrier. If the bulls succeed in clearing the $1.45 and $1.46 resistance levels, there could be a strong increase. In this case, the price could even rally above the $1.60 and $1.65 levels.
Dips Limited in XRP?
If ripple fails to clear the $1.45 resistance or $1.46, it could correct lower. An initial support on the downside is near the $1.3200 level
The next major support is near the $1.30 level. If there is a downside break and close below the $1.30 level, the price could turn bearish in the short-term. In the stated scenario, the price is likely to drop towards the $1.15 support zone in the coming sessions.
Technical Indicators
4-Hours MACD – The MACD for XRP/USD is slowly gaining pace in the bullish zone.
4-Hours RSI (Relative Strength Index) – The RSI for XRP/USD is now above the 50 level.
Major Support Levels – $1.32, $1.30 and $1.15.
Major Resistance Levels – $1.45, $1.46 and $1.65.