
Reason to trust
How Our News is Made
Strict editorial policy that focuses on accuracy, relevance, and impartiality
Ad discliamer
Morbi pretium leo et nisl aliquam mollis. Quisque arcu lorem, ultricies quis pellentesque nec, ullamcorper eu odio.
Ripple is up over 10% and it spiked above $0.3000 against the US Dollar. XRP price is showing positive signs and it is likely to continue higher towards $0.3100 and $0.3200.
- Ripple is showing a few bullish signs above $0.2700 and $0.2800 against the US dollar.
- The price is trading nicely above the 100 simple moving average (4-hours), but it is facing hurdles near $0.3000.
- There was a break above a major bearish trend line with resistance near $0.2700 on the 4-hours chart of the XRP/USD pair (data source from Kraken).
- The pair could continue to rise towards $0.3200 if there is a close above the $0.3000 level.
Ripple’s XRP Price Surges 10%
After forming a base above the $0.2500 level, ripple’s XRP price started a fresh increase. The price settled above the $0.2650 level to move into a short-term bullish zone.
Recently there was a decent upward move in bitcoin and Ethereum, opening the doors for a surge in XRP above $0.2720. There was also a break above a major bearish trend line with resistance near $0.2700 on the 4-hours chart of the XRP/USD pair.
The pair rallied above $0.2800 and the 100 simple moving average (4-hours). The price even spiked above the 61.8% Fib retracement level of the downward move from the $0.3305 swing high to $0.2396 low.
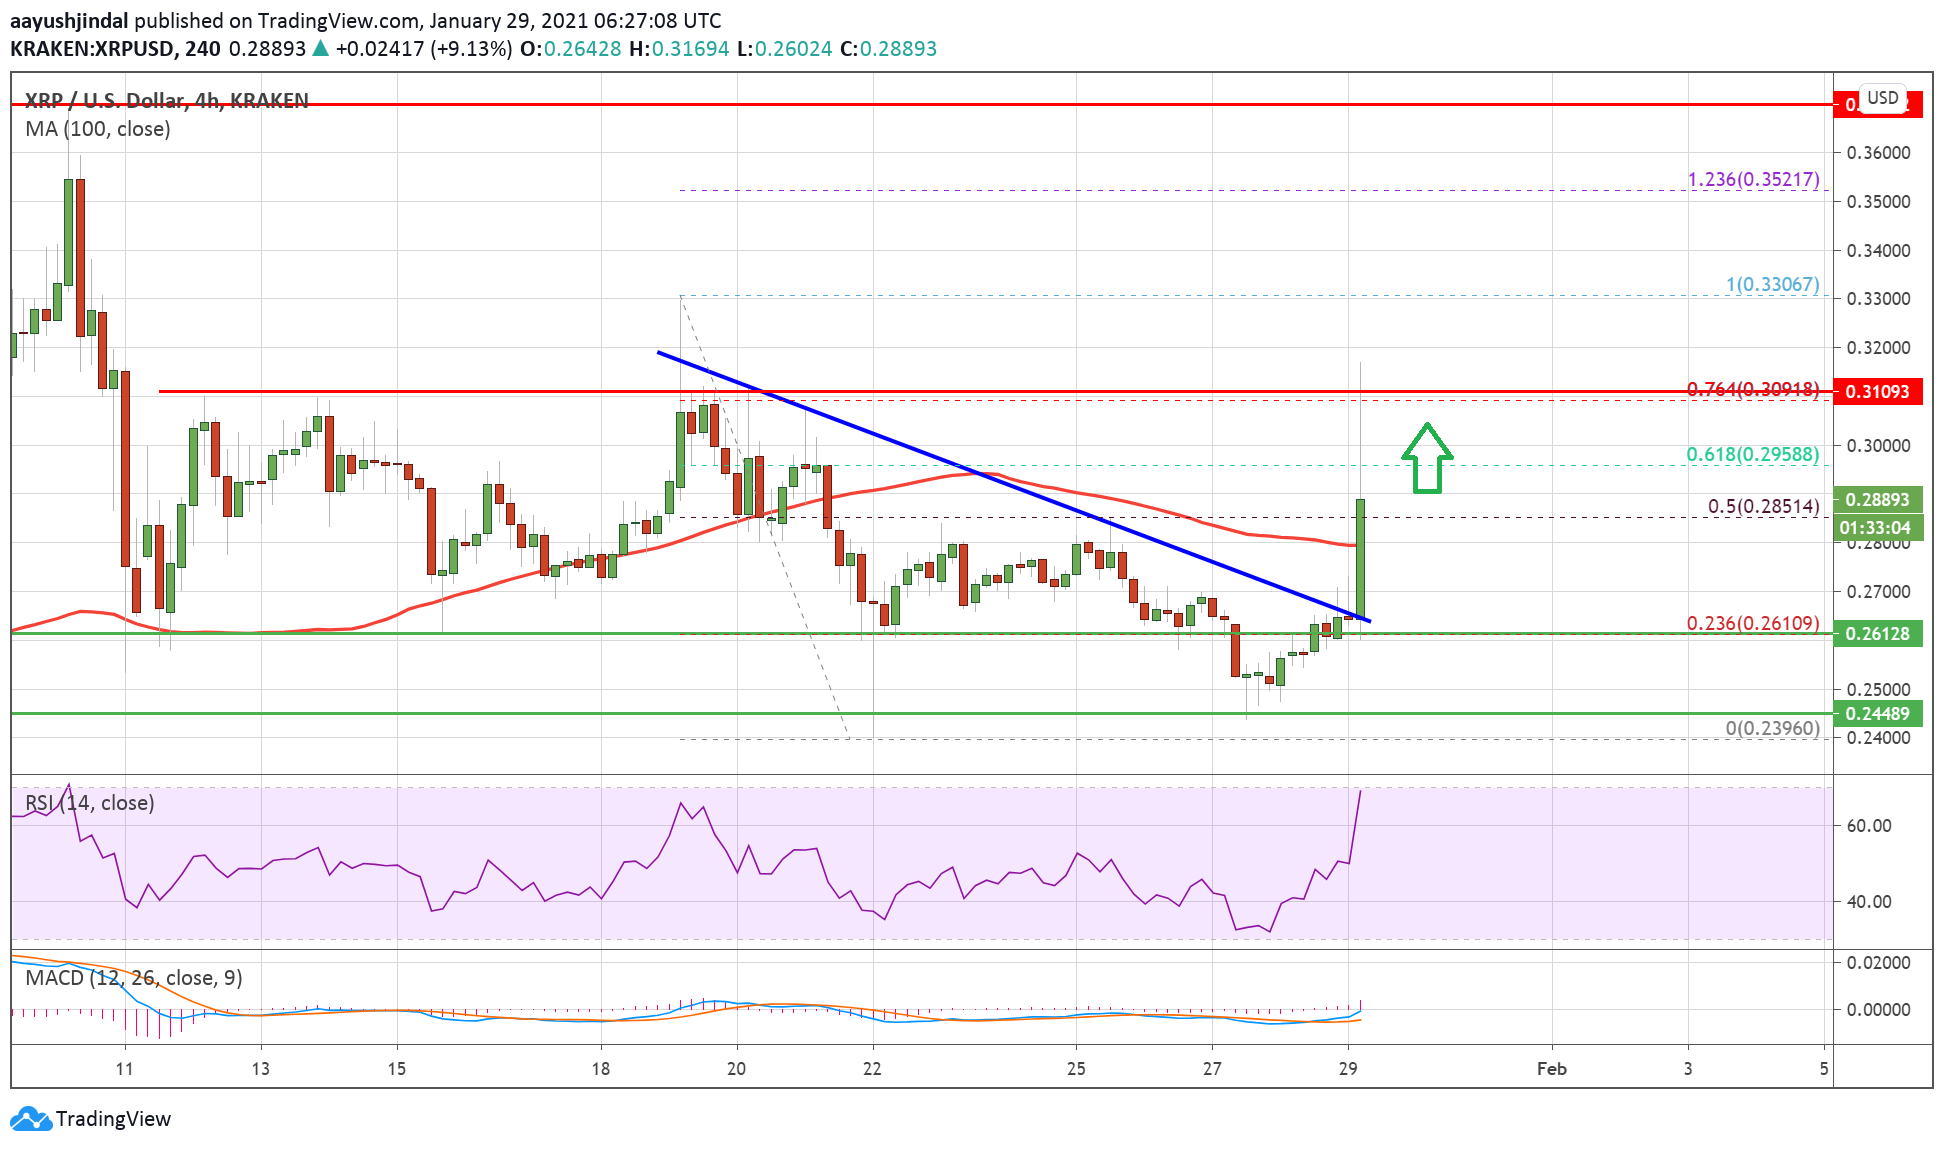
Source: XRPUSD on TradingView.com
However, the price failed to surpass the main $0.3100 resistance level. It also failed near the 76.4% Fib retracement level of the downward move from the $0.3305 swing high to $0.2396 low. The price is currently dipping, but there are high chances of a fresh increase above $0.3000.
A close above the $0.3000 level may possibly increase the chances of a push above the $0.3100 resistance. The next major resistance is near the $0.3200 level.
Fresh Dip in XRP?
If ripple fails to climb back above $0.3000, it could correct lower. An initial support is near the $0.2800 level and the 100 SMA (H4).
A downside break below the $0.2800 support zone could open the doors for a push towards the $0.2700 support. The next major support is near the $0.2620 level and the broken trend line.
Technical Indicators
4-Hours MACD – The MACD for XRP/USD is gaining pace in the bullish zone.
4-Hours RSI (Relative Strength Index) – The RSI for XRP/USD is now well above the 50 level.
Major Support Levels – $0.2800, $0.2700 and $0.2620.
Major Resistance Levels – $0.3000, $0.3100 and $0.3200.


