
Reason to trust
How Our News is Made
Strict editorial policy that focuses on accuracy, relevance, and impartiality
Ad discliamer
Morbi pretium leo et nisl aliquam mollis. Quisque arcu lorem, ultricies quis pellentesque nec, ullamcorper eu odio.
Ripple is currently correcting higher from the $0.1780 support zone against the US Dollar. However, XRP price is likely to face another rejection near $0.1880 or $0.1900.
- Ripple price is trading in a negative zone below the $0.1880 resistance level against the US dollar.
- The bulls are likely to face a strong selling interest near $0.1880 and $0.1900.
- There is a major bearish trend line forming with resistance near $0.1885 on the hourly chart of the XRP/USD pair (data source from Kraken).
- The pair is likely to resume its decline as long as it is below $0.1900.
Ripple Price Could Dive Further
After a close below the $0.1900 pivot level, ripple extended its decline. XRP price broke the key $0.1880 support zone to move further into a bearish zone.
The bears were able to push the price below the $0.1850 level and the 100 hourly simple moving average. A new weekly low is formed near the $0.1783 and the price is currently recovering higher.
There was a break above the $0.1800 and $0.1820 levels. Ripple managed to recover above the 23.6% Fib retracement level of the downward move from the $0.1950 high to $0.1780 swing low.
On the upside, the previous supports near $0.1850 and $0.1865 are currently acting as hurdles for the bulls. The 50% Fib retracement level of the downward move from the $0.1950 high to $0.1780 swing low is also near the $0.1866 to stop the current wave.
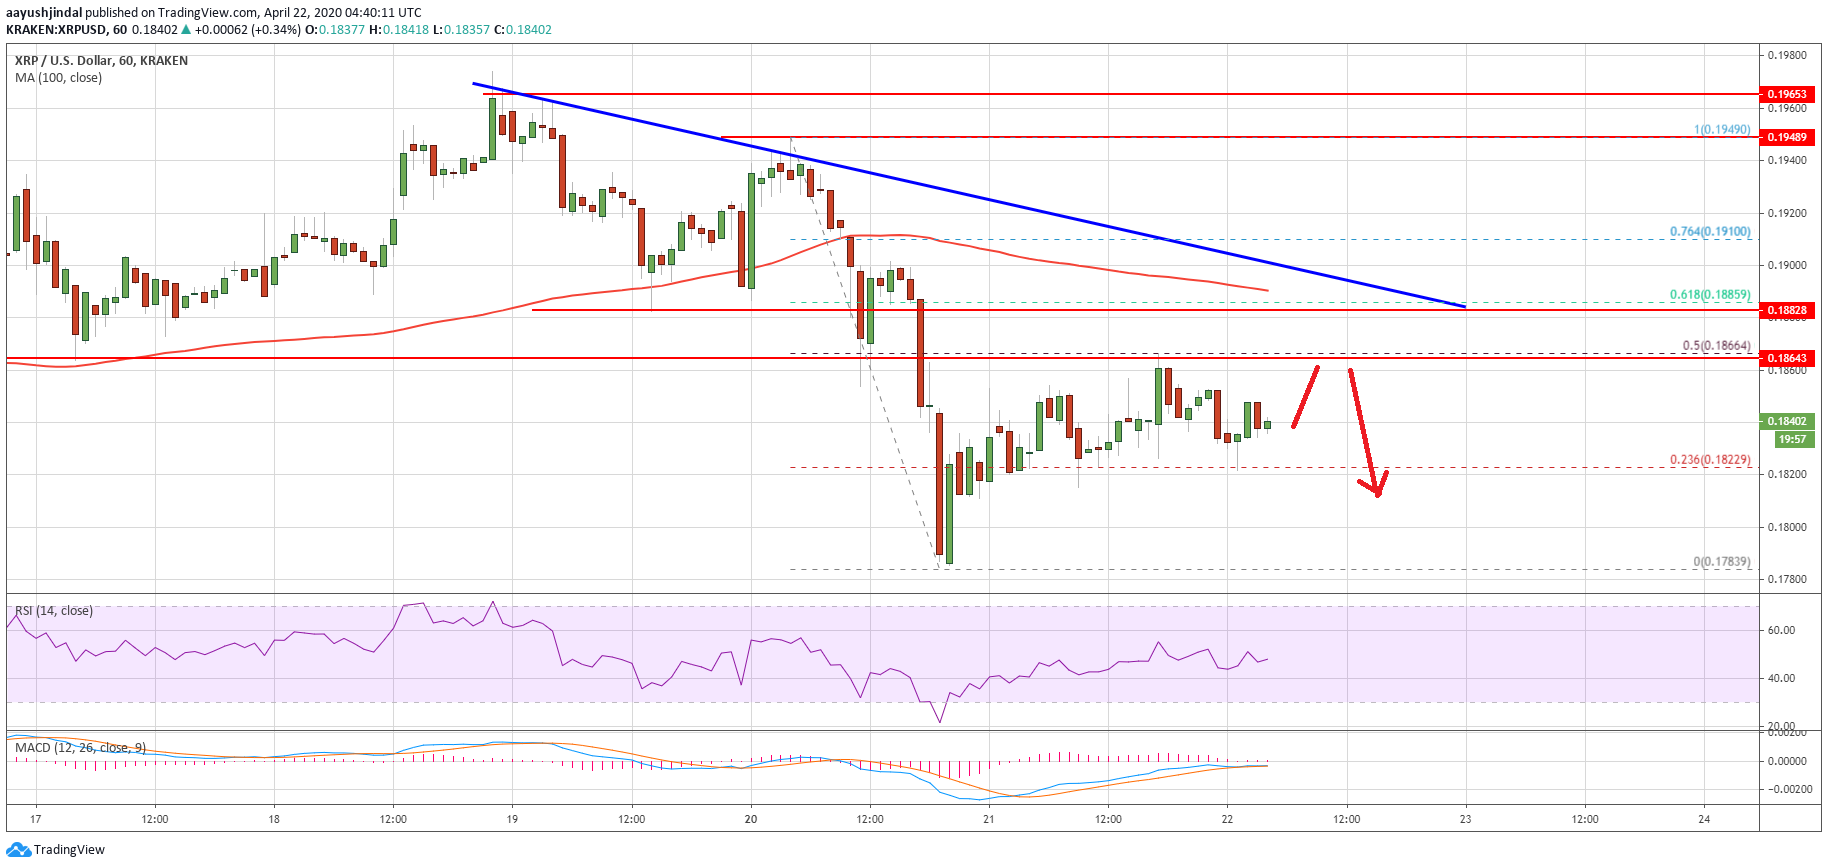
More importantly, there is a major bearish trend line forming with resistance near $0.1885 on the hourly chart of the XRP/USD pair. The 100 hourly simple moving average is also positioned near the $0.1900 zone to prevent gains.
A successful close above the $0.1880 resistance and then a follow up move above the $0.1900 level is needed for upside continuation in the near term.
Another Rejection?
Ripple is likely to struggle near the $0.1880 and $0.1900 resistance levels. In the mentioned case, there are chances of a fresh bearish wave below the $0.1820 level.
The first major support on the downside is near the $0.1780 level, below which there are high chances of a drop towards the $0.1700 level in the coming sessions.
Technical Indicators
Hourly MACD – The MACD for XRP/USD is slowly moving back into the bearish zone.
Hourly RSI (Relative Strength Index) – The RSI for XRP/USD is struggling to move above the 50 level.
Major Support Levels – $0.1820, $0.1780 and $0.1700.
Major Resistance Levels – $0.1865, $0.1880 and $0.1900.
Take advantage of the trading opportunities with Plus500
Risk disclaimer: 76.4% of retail CFD accounts lose money.


