
Reason to trust
How Our News is Made
Strict editorial policy that focuses on accuracy, relevance, and impartiality
Ad discliamer
Morbi pretium leo et nisl aliquam mollis. Quisque arcu lorem, ultricies quis pellentesque nec, ullamcorper eu odio.
Ripple is slowly moving lower and now trading well below $0.1920 against the US Dollar. XRP price remains at a risk of more losses unless it gains strength for a push above $0.1900.
- Ripple is facing an increase in selling pressure below the $0.1920 resistance against the US dollar.
- The price is currently trading below the $0.1900 support and the 100 hourly simple moving average.
- There is a declining channel forming with resistance near $0.1890 on the hourly chart of the XRP/USD pair (data source from Kraken).
- The pair could continue to move down towards the $0.1850 and $0.1820 support levels.
Ripple Price Could Extend its Decline
Ripple price started a fresh decrease after it failed to test the $0.2000 resistance. XRP traded as high as $0.1986 and recently declined below the $0.1950 support zone.
The bears gained traction and pushed the price below the $0.1900 support and the 100 hourly simple moving average. During the decline, there was a break below a major bullish trend line with support at $0.1910 on the hourly chart of the XRP/USD pair.
It traded as low as $0.1868 and it seems like there are chances of more losses. An initial resistance is near the $0.1890 level or the 23.6% Fib retracement level of the recent slide from the $0.1986 high to $0.1868 low.
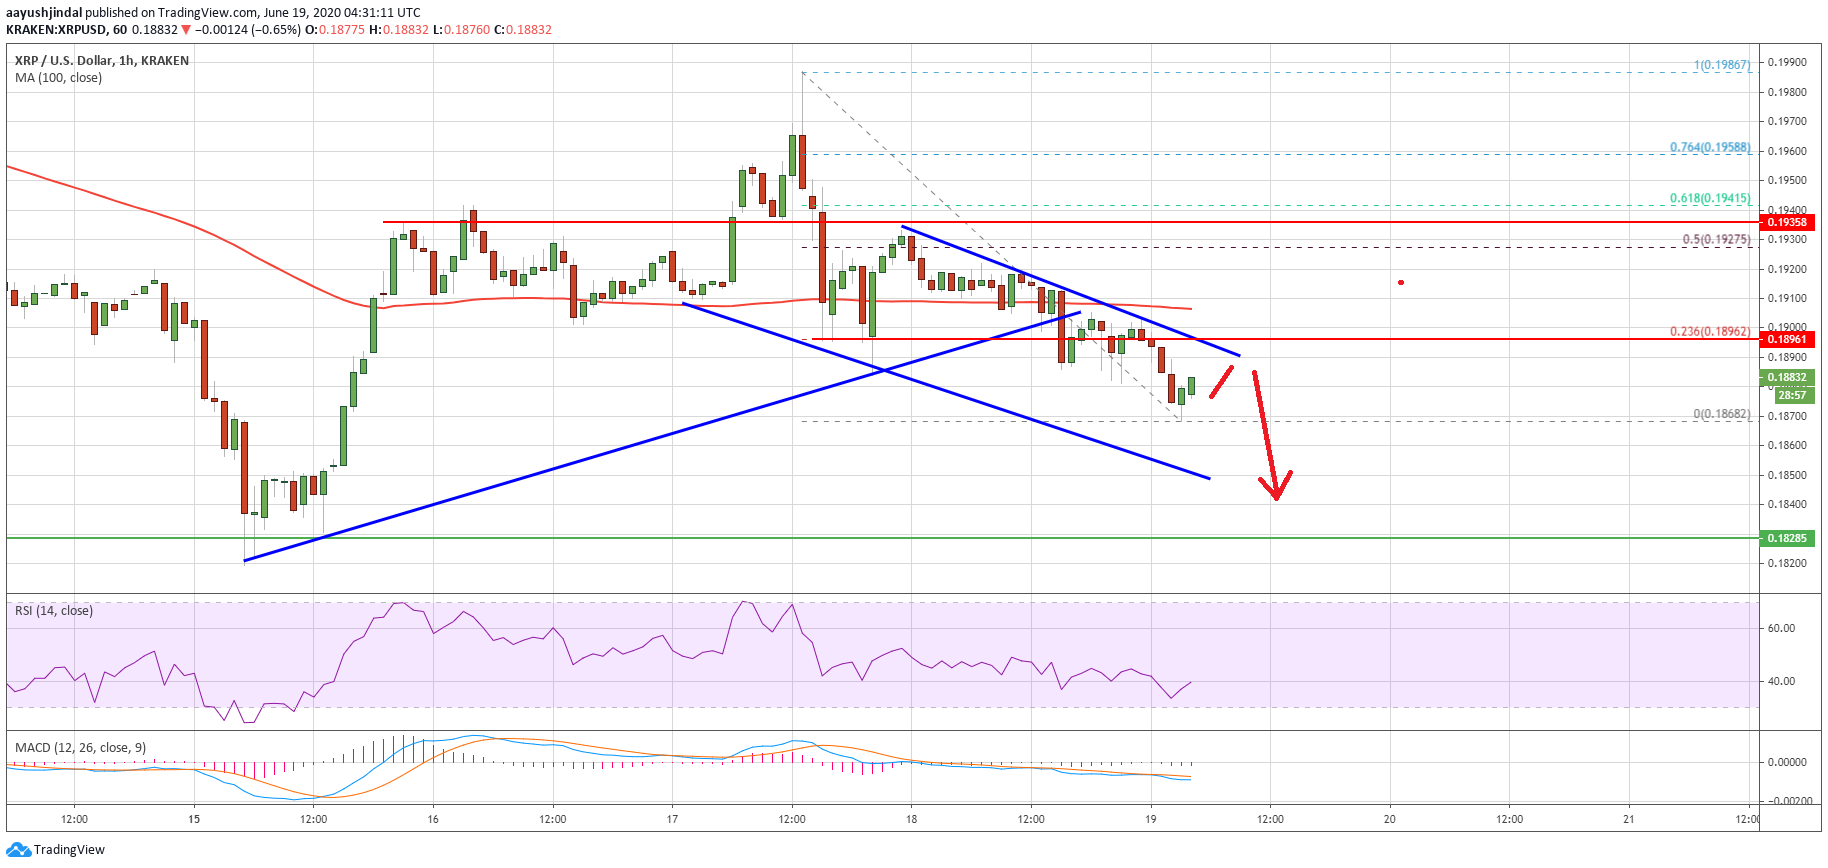
Ripple price below $0.1900. Source: TradingView.com
There is also a declining channel forming with resistance near $0.1890 on the same chart. The first key resistance is near the $0.1900 zone and the 100 hourly simple moving average. The next major resistance is near the $0.1925 level or the 50% Fib retracement level of the recent slide from the $0.1986 high to $0.1868 low.
Clearly, ripple is facing a lot of hurdles on the upside near $0.1900 and $0.1925. A successful close above $0.1900 and then a follow up break above the $0.1925 level is needed for a strong upward move.
More Losses in XRP?
If ripple fails to recover above $0.1900 and the 100 hourly SMA, there are chances of more downsides. An initial support on the downside is near the $0.1850 level.
The main support is near the $0.1820 level, below which the bears are likely to aim a downside break below the $0.1800 support in the coming days.
Technical Indicators
Hourly MACD – The MACD for XRP/USD is moving nicely in the bearish zone.
Hourly RSI (Relative Strength Index) – The RSI for XRP/USD is now correcting higher from the 30 level.
Major Support Levels – $0.1850, $0.1820 and $0.1800.
Major Resistance Levels – $0.1900, $0.1925 and $0.1950.
Take advantage of the trading opportunities with Plus500
Risk disclaimer: 76.4% of retail CFD accounts lose money.


