Reason to trust

How Our News is Made
Strict editorial policy that focuses on accuracy, relevance, and impartiality
Ad discliamer
Morbi pretium leo et nisl aliquam mollis. Quisque arcu lorem, ultricies quis pellentesque nec, ullamcorper eu odio.
Ripple Price Key Highlights
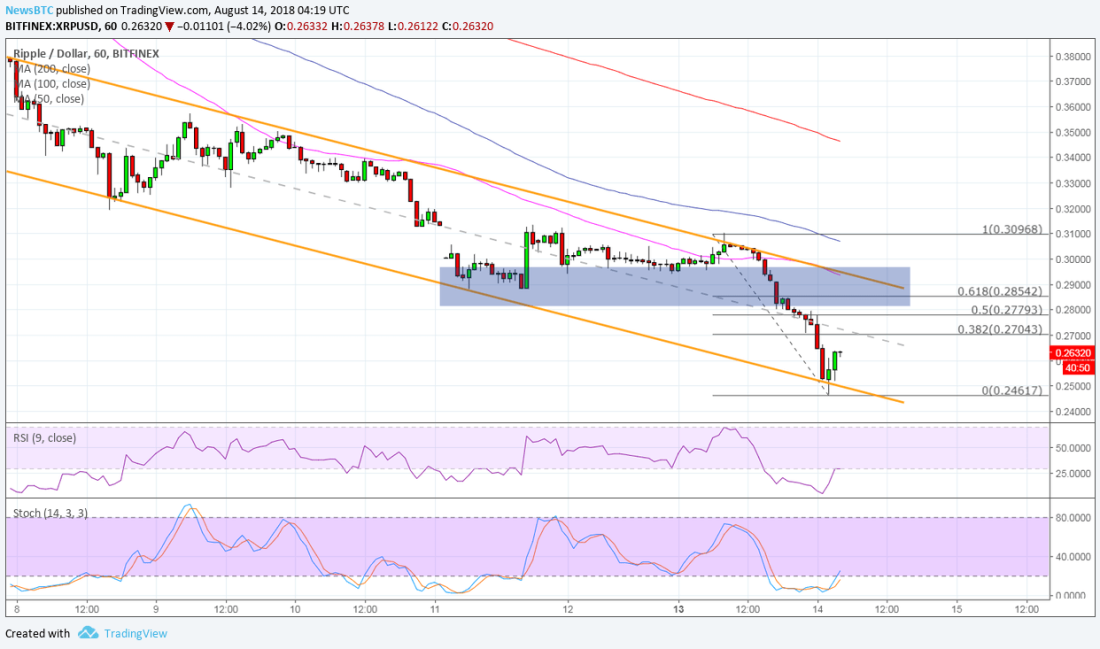
- Ripple price recently fell through short-term consolidation to test the bottom of its channel.
- Support appears to be holding, so price could be due for a pullback to the descending channel resistance from here.
- The Fib retracement tool shows the potential correction levels where more bears might be waiting.
Ripple price fell to the bottom of its descending channel on the 1-hour chart and might be due for a quick correction.
Technical Indicators Signals
The 100 SMA is below the longer-term 200 SMA to show that the path of least resistance is to the downside. In other words, the downtrend is more likely to resume than to reverse.
RSI is already indicating oversold conditions or that sellers are feeling exhausted. Turning higher could bring more buyers in and allow the correction to unfold. Similarly stochastic appears to be making its way out of the oversold region to signal a pickup in bullish momentum.
Both oscillators have plenty of room to climb, so Ripple might even have a chance at busting through the channel top if buyers persist. Then again, the 100 SMA is just close by and could add another layer of resistance near the swing high.

Market Factors
Ripple drew some support from news that the US District Court of the Northern District of California has ruled to deny a motion to demand against Ripple, its subsidiary, and CEO. This lawsuit was filed by XRP investor Ryan Coffey in a San Francisco court on May 3, 2018, claiming that he lost $551.89 while trading Ripple tokens. The court said:
“The parties candidly admit that their research failed to turn up any case directly addressing this question and the court’s own research fared no better.”
The court decision did add a bit of legitimacy for Ripple as these lawsuits tend to threaten the reputation of altcoins and their founders.


