
Reason to trust
How Our News is Made
Strict editorial policy that focuses on accuracy, relevance, and impartiality
Ad discliamer
Morbi pretium leo et nisl aliquam mollis. Quisque arcu lorem, ultricies quis pellentesque nec, ullamcorper eu odio.
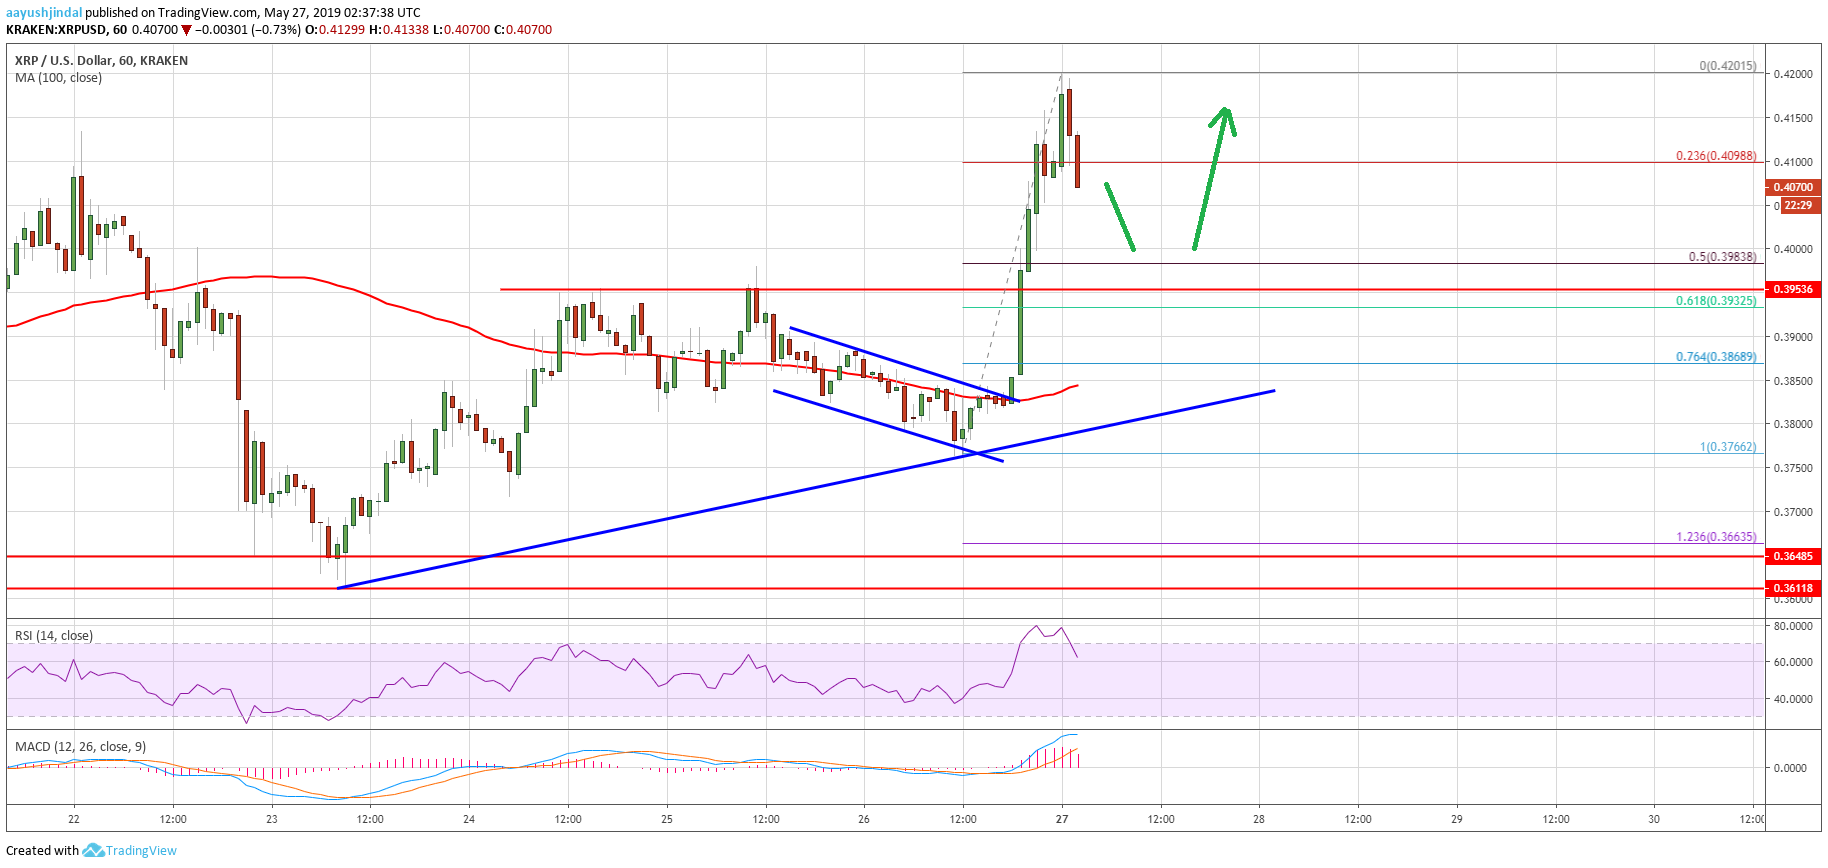
- Ripple price traded higher recently and broke the $0.3950 and $0.4120 resistances against the US dollar.
- The price tested the $0.4200 resistance area and it is currently correcting gains.
- There is a connecting bullish trend line forming with support at $0.3850 on the hourly chart of the XRP/USD pair (data source from Kraken).
- The pair remains supported on dips and it could bounce back after testing the $0.3980 or $0.3950 support.
Ripple price is showing positive signs above $0.3950 against the US Dollar, while declining vs bitcoin. XRP remains well bid and dips are likely to present buying opportunities.
Ripple Price Analysis
After forming a strong support base above the $0.3660 level, ripple price climbed higher against the US Dollar. The XRP/USD pair traded above a couple of important resistances near the $0.3800 and $0.3850 levels. The price moved into a positive zone above the $0.3920 level. There was a close above the $0.3950 level and the 100 hourly simple moving average. Besides, there was a break above a declining channel at $0.3860 to start the recent upward move.
Finally, the price broke the $0.4000 and $0.4120 resistance levels. It traded as high as $0.4205 and it is currently correcting gains. It tested the $0.4080 level and the 23.6% Fib retracement level of the recent wave from the $0.3766 low to $0.4205 high. On the downside, there are many supports near the $0.4000, $0.3980 and $0.3950 levels. Moreover, the 50% Fib retracement level of the recent wave from the $0.3766 low to $0.4205 high is near the $0.3985 level to act as a strong support.
Therefore, if the price continues to move down, it could find support near $0.4000 or $0.3950. Moreover, there is a connecting bullish trend line forming with support at $0.3850 on the hourly chart of the XRP/USD pair. On the upside, an initial resistance is near the $0.4150 level, followed by the $0.4200 zone. A successful break above the $0.4205 high might clear the path for more gains towards the $0.4250 and $0.4320 in the coming sessions.
Looking at the chart, ripple price is clearly trading with a positive angle above the $0.3950. In the short term, there could be range moves above $0.3980 or $0.3950. However, the correction could complete near $0.4000 or $0.3950 before a fresh increase. On the upside, the bulls are likely to take control above the $0.4200 pivot zone.
Technical Indicators
Hourly MACD – The MACD for XRP/USD is currently gaining strength in the bullish zone.
Hourly RSI (Relative Strength Index) – The RSI for XRP/USD is currently correcting lower from the overbought zone to 65.
Major Support Levels – $0.4000, $0.3980 and $0.3950.
Major Resistance Levels – $0.4150, $0.4200 and $0.4320.


