
Reason to trust
How Our News is Made
Strict editorial policy that focuses on accuracy, relevance, and impartiality
Ad discliamer
Morbi pretium leo et nisl aliquam mollis. Quisque arcu lorem, ultricies quis pellentesque nec, ullamcorper eu odio.
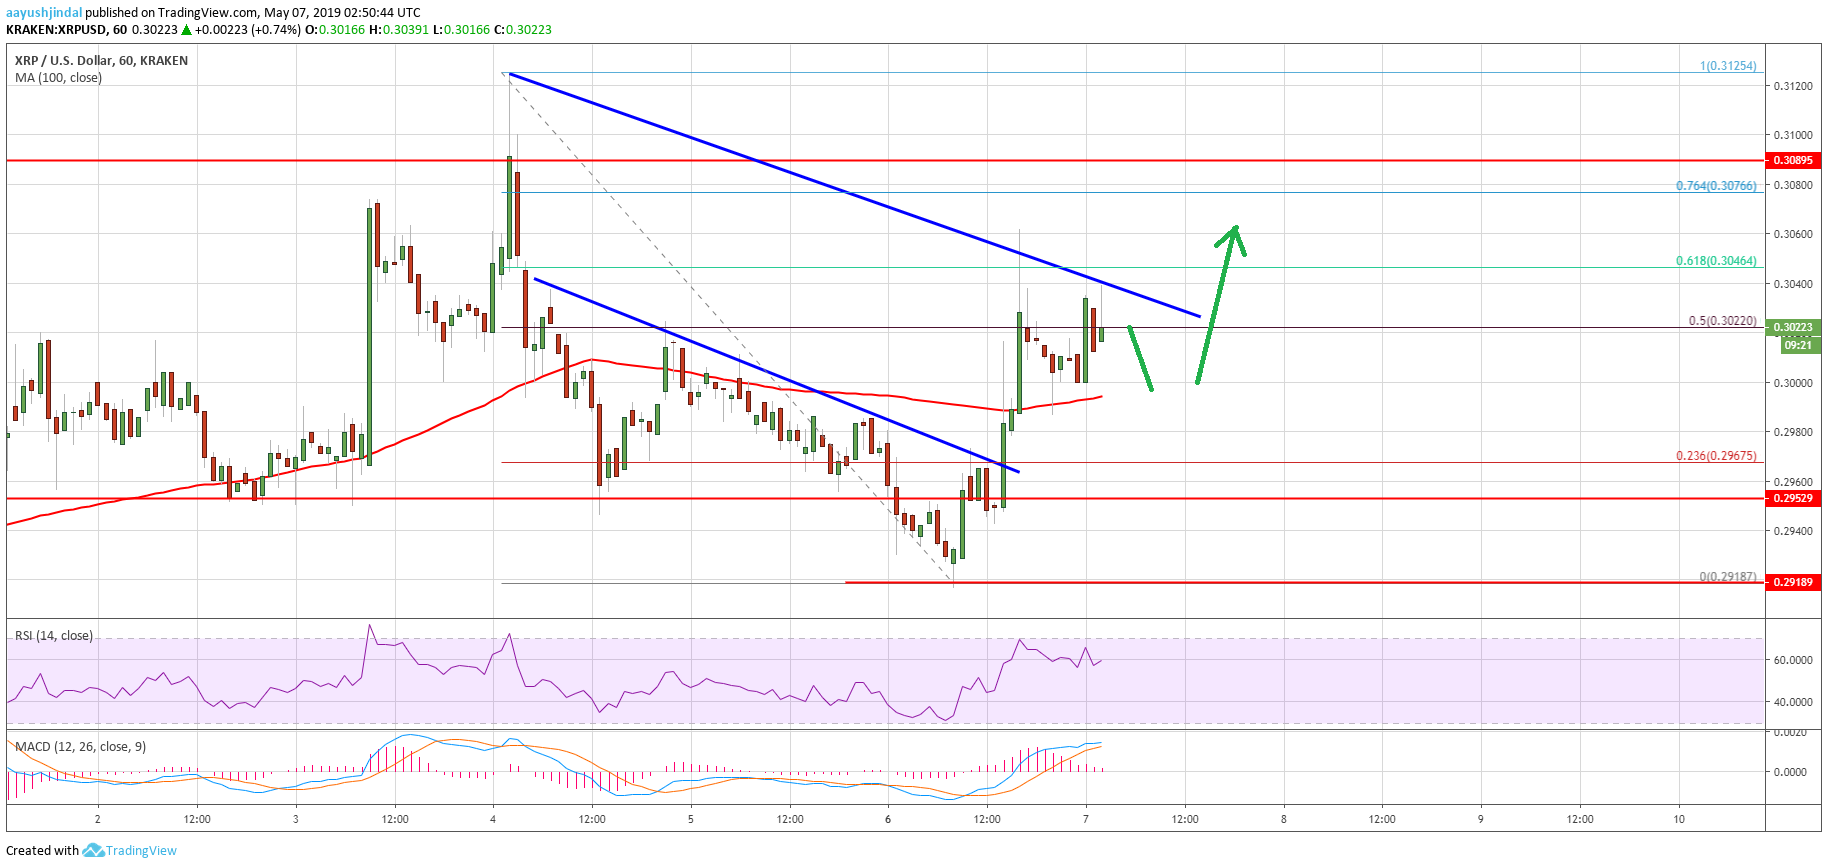
- Ripple price traded to a new weekly low at $0.2918 and recently recovered against the US dollar.
- The price climbed higher and broke the $0.2985 and $0.3000 resistance levels.
- There was a break above a key bearish trend line with resistance near $0.2970 on the hourly chart of the XRP/USD pair (data source from Kraken).
- The pair is currently facing a strong resistance near the $0.3040 and $0.3050 levels.
Ripple price started a decent recovery against the US Dollar after a strong upward move in bitcoin and Ethereum. XRP broke the $0.3000 level and it may move higher towards $0.3100.
Ripple Price Analysis
Yesterday, we saw an increase in bearish pressure ripple price below $0.3020 against the US Dollar. The XRP/USD pair traded below the key $0.3000 support level and even settled below the 100 hourly simple moving average. It opened the doors for more losses and the price even broke the $0.2950 support level. A new weekly low was formed near $0.2918 and recently the price bounced back. The main driving force was bitcoin, trading above the $5,850 resistance level.
During the recent rise, there was a break above a key bearish trend line with resistance near $0.2970 on the hourly chart of the XRP/USD pair. There was a clear break above the 50% Fib retracement level of the downside move from the $0.3125 high to $0.2918 low. Besides, the pair broke the $0.3000 resistance and the 100 hourly simple moving average. However, the price faced a strong resistance near the $0.3040 and $0.3050 levels. It seems like the price struggled to clear the 61.8% Fib retracement level of the downside move from the $0.3125 high to $0.2918 low.
There is also a connecting bearish trend line in place with resistance near $0.3040 on the same chart. Therefore, a clear break above the $0.3040 and $0.3050 resistance levels may open the doors for more gains. The next key resistance is near the $0.3080 and $0.3100 levels. Above $0.3100, the price may attempt to clear the last swing high near the $0.3125 level.
Looking at the chart, ripple price clearly recovered nicely after trading to a new weekly low and $0.3000. The current price action is positive above $0.3000. If there is a downside correction, the price may find bids near the $0.3000 level and the 100 hourly SMA. Any further declines may push the price back in a bearish zone towards $0.2920.
Technical Indicators
Hourly MACD – The MACD for XRP/USD is showing negative signs in the bullish zone.
Hourly RSI (Relative Strength Index) – The RSI for XRP/USD is currently retreating from the 60 level.
Major Support Levels – $0.3010, $0.3000 and $0.2950.
Major Resistance Levels – $0.3040, $0.3080 and $0.3100.


