
Reason to trust
How Our News is Made
Strict editorial policy that focuses on accuracy, relevance, and impartiality
Ad discliamer
Morbi pretium leo et nisl aliquam mollis. Quisque arcu lorem, ultricies quis pellentesque nec, ullamcorper eu odio.
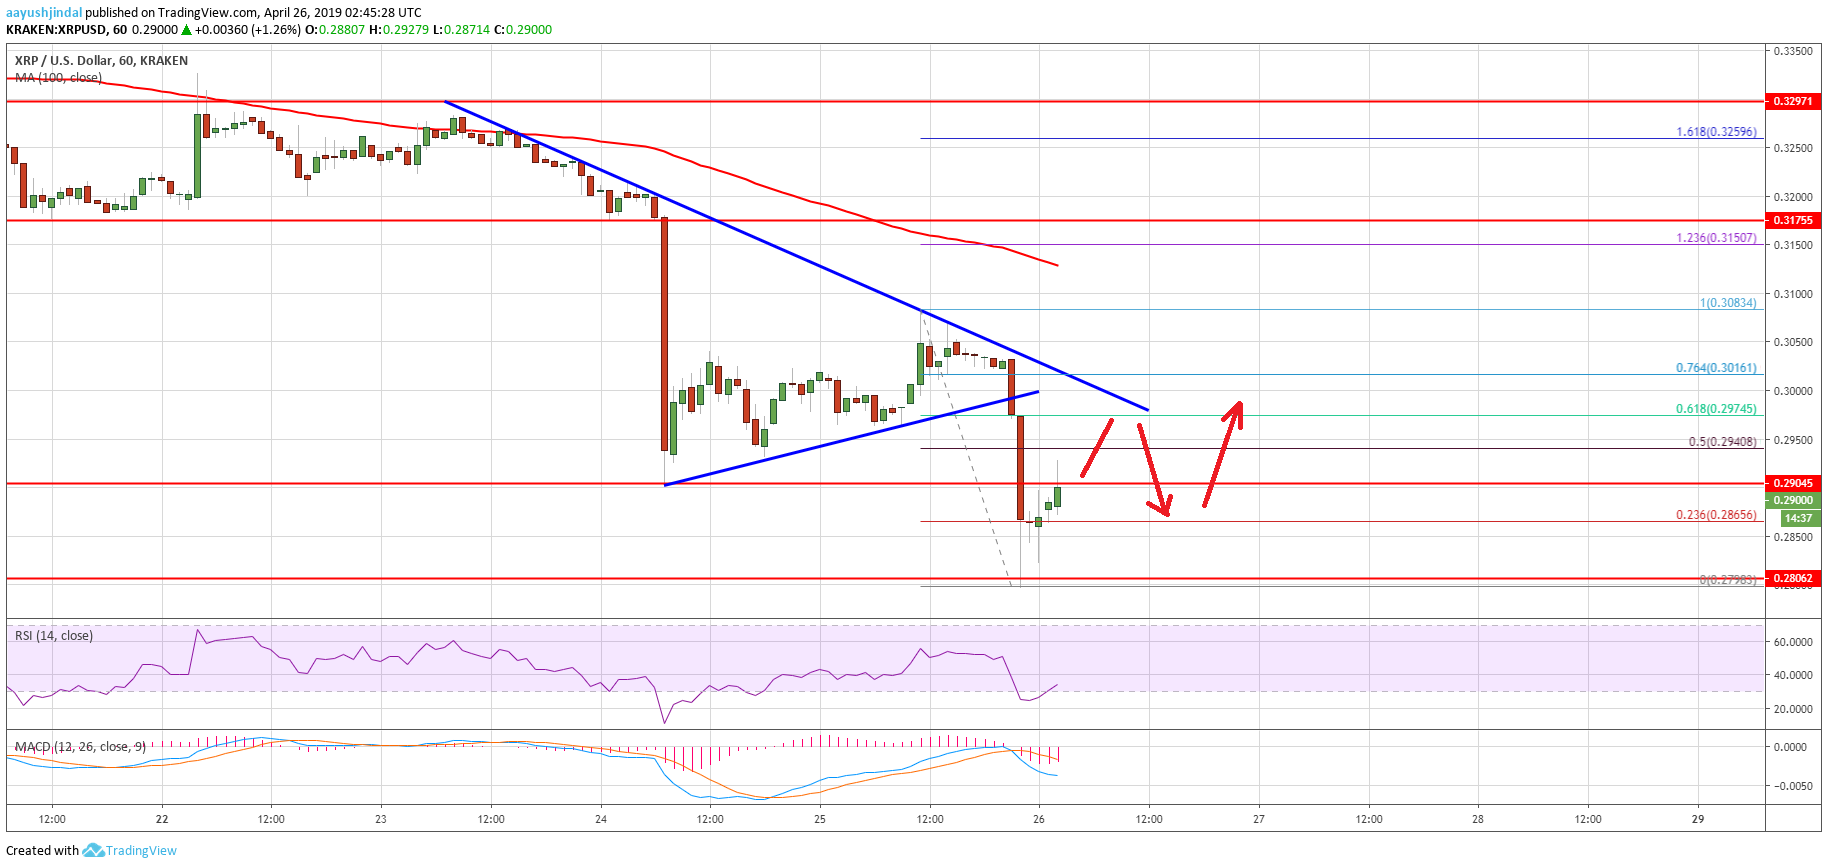
- Ripple price declined heavily after it broke the $0.3000 support area against the US dollar.
- The price broke the $0.2920 and $0.2850 support levels, and traded close to $0.2800.
- Yesterday’s highlighted key bearish trend line is intact with resistance at $0.2980 on the hourly chart of the XRP/USD pair (data source from Kraken).
- The pair could correct higher in the short term, but sellers are likely to protect $0.2980 and $0.3000.
Ripple price nosedived below many important supports against the US Dollar and bitcoin. XRP tested $0.2800 and it is currently correcting higher towards the previous support levels.
Ripple Price Analysis
This week, we mostly saw bearish moves in ripple price below $0.3200 against the US Dollar. The XRP/USD pair gained bearish momentum after it broke the $0.3060 support and the 100 hourly simple moving average. Sellers got control and pushed the price below the key $0.3000 support level. Finally, there was a sharp decline below the $0.2950 and $0.2920 support levels. The price cleared a connecting bullish trend line with support at $0.3000 to enter a bearish zone.
The decline was such that the price spiked towards the $0.2800 level and formed a new weekly low at $0.2798. At the moment, the price is correcting higher above $0.2850. It broke the 23.6% Fib retracement level of the recent decline from the $0.3083 high to $0.2798 low. However, there are many resistances near the $0.2950 and $0.2970 levels. The 50% Fib retracement level of the recent decline from the $0.3083 high to $0.2798 low is also near the $0.2940 level to act as a hurdle. Moreover, yesterday’s highlighted key bearish trend line is intact with resistance at $0.2980 on the hourly chart of the XRP/USD pair.
Therefore, if the price corrects higher, it could face a strong resistance near the $0.2940 and $0.2970 levels. Only a successful close above the $0.3000 level is likely to open the doors for a decent rebound. If not, the price is likely to remain in a downtrend below the $0.2970 resistance. On the downside, an initial supports are near the $0.2820 and $0.2800 levels. If there are more losses, the price could test $0.2750.
Looking at the chart, ripple price seems to be struggling below the $0.3000 pivot level. As long as it stays below $0.3000, sellers remain in control. An upside correction from the current levels towards $0.2970 can be seen as selling opportunity.
Technical Indicators
Hourly MACD – The MACD for XRP/USD is currently placed strongly in the bearish zone.
Hourly RSI (Relative Strength Index) – The RSI for XRP/USD is currently recovering from the extreme oversold levels.
Major Support Levels – $0.2820, $0.2800 and $0.2750.
Major Resistance Levels – $0.2950, $0.2970 and $0.3000.


