
Reason to trust
How Our News is Made
Strict editorial policy that focuses on accuracy, relevance, and impartiality
Ad discliamer
Morbi pretium leo et nisl aliquam mollis. Quisque arcu lorem, ultricies quis pellentesque nec, ullamcorper eu odio.
- Ripple price traded towards the $0.3080 level and recently corrected lower against the US dollar.
- The price traded lower and broke the $0.3040 and $0.3020 support levels.
- There is a key bullish trend line in place with support near $0.2965 on the hourly chart of the XRP/USD pair (data source from Kraken).
- The pair could dips a few points, but it is likely to bounce back as long as it is above $0.2950
Ripple price is trading with a positive bias above key supports against the US Dollar, but struggling vs bitcoin. XRP could bounce back as long as it is holding the $0.2950 support.
Ripple Price Analysis
Yesterday, we saw a nice upward move in ripple price above the $0.2950 and $0.3000 resistances against the US Dollar. The XRP/USD pair gained traction and broke the $0.3050 level as well and settled above the 100 hourly simple moving average. It traded close to the $0.3090 level and formed a new swing high near $0.3088. Later, it started a downside correction and traded below the $0.3050 support. There was a break below the 23.6% Fib retracement level of the last wave from the $0.2835 low to $0.3088 high.
The price even cleared the $0.3000 support level and tested the main $0.2950 support level. Besides, the 50% Fib retracement level of the last wave from the $0.2835 low to $0.3088 high prevented losses. The price is currently moving higher and trading well above $0.2950. There is also a key bullish trend line in place with support near $0.2965 on the hourly chart of the XRP/USD pair. The pair seems to be well supported near $0.2960 and $0.2950. Besides, the 100 hourly SMA is also positioned near the $0.2950 support area.
On the upside, an initial resistance is near the $0.3000 level, above which the price may test $0.3020. However, a successful close above $0.3050 will most likely set the pace for more gains above the $0.3100 resistance level. The next key resistances are near $0.3120 and $0.3125.
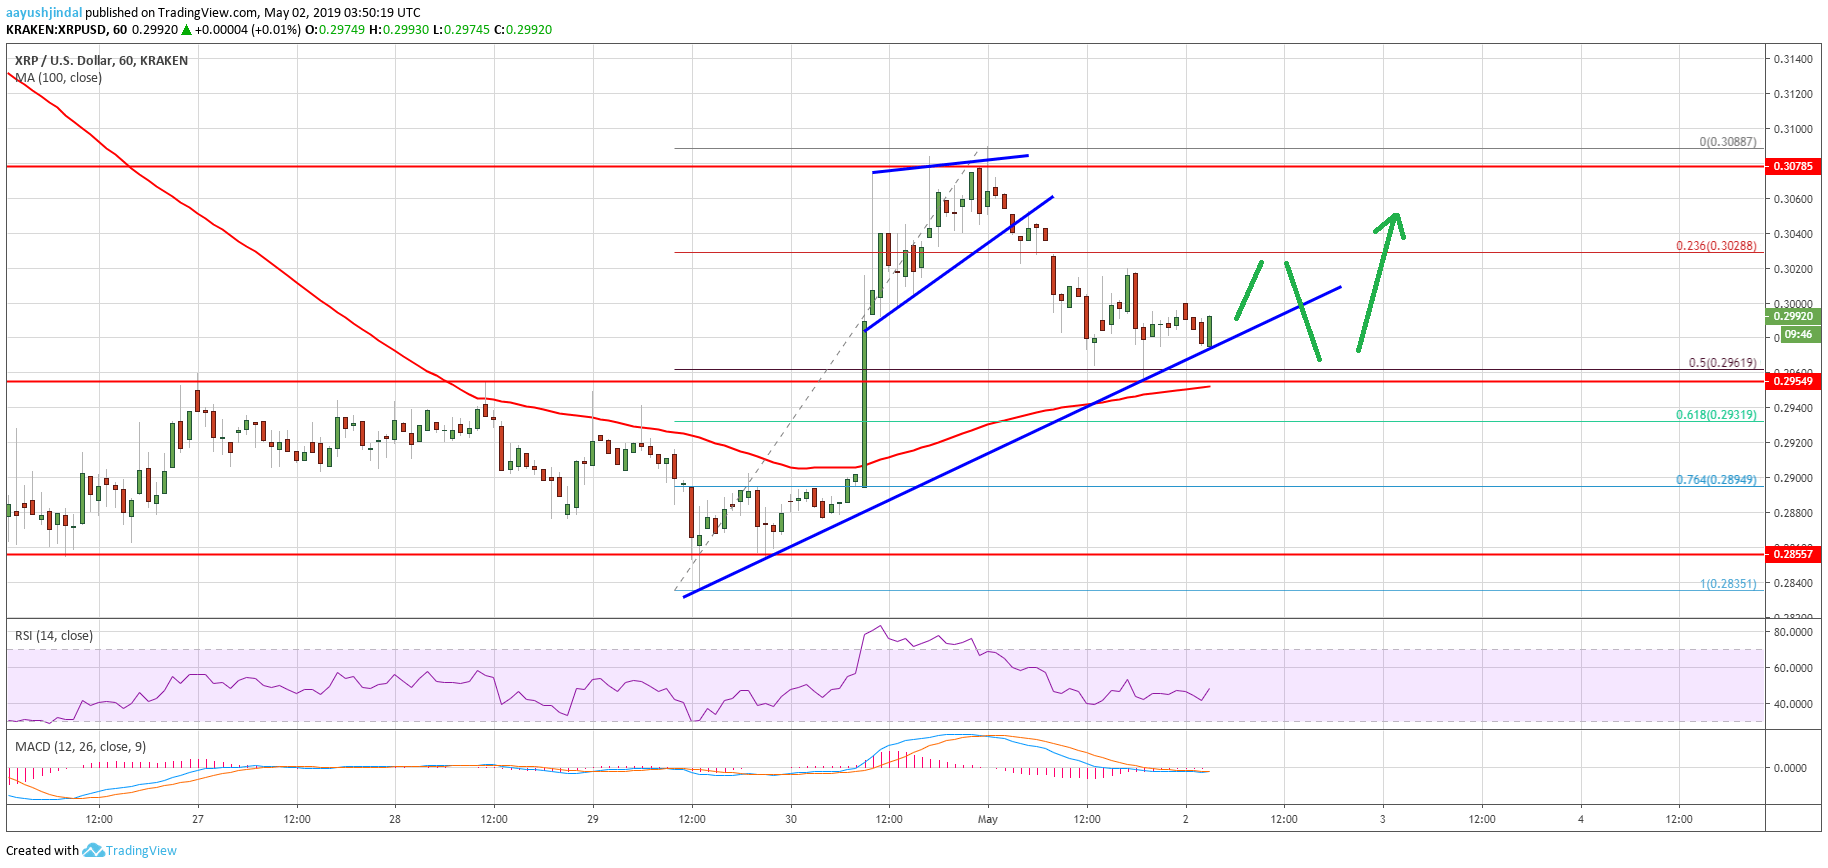
Looking at the chart, ripple price is clearing trading above the key $0.2960 and $0.2950 support levels. If there is a downside break below the $0.2950 support and the 100 hourly SMA, the price could move into a bearish zone. An immediate support is near the $0.2910 level, below which the price may revisit the $0.2850 support level in the near term.
Technical Indicators
Hourly MACD – The MACD for XRP/USD is slowly moving in the bearish zone.
Hourly RSI (Relative Strength Index) – The RSI for XRP/USD is currently below the 50 level, but it is holding the 40 level.
Major Support Levels – $0.2960, $0.2950 and $0.2910.
Major Resistance Levels – $0.3020, $0.3050 and $0.3085.


