
Reason to trust
How Our News is Made
Strict editorial policy that focuses on accuracy, relevance, and impartiality
Ad discliamer
Morbi pretium leo et nisl aliquam mollis. Quisque arcu lorem, ultricies quis pellentesque nec, ullamcorper eu odio.
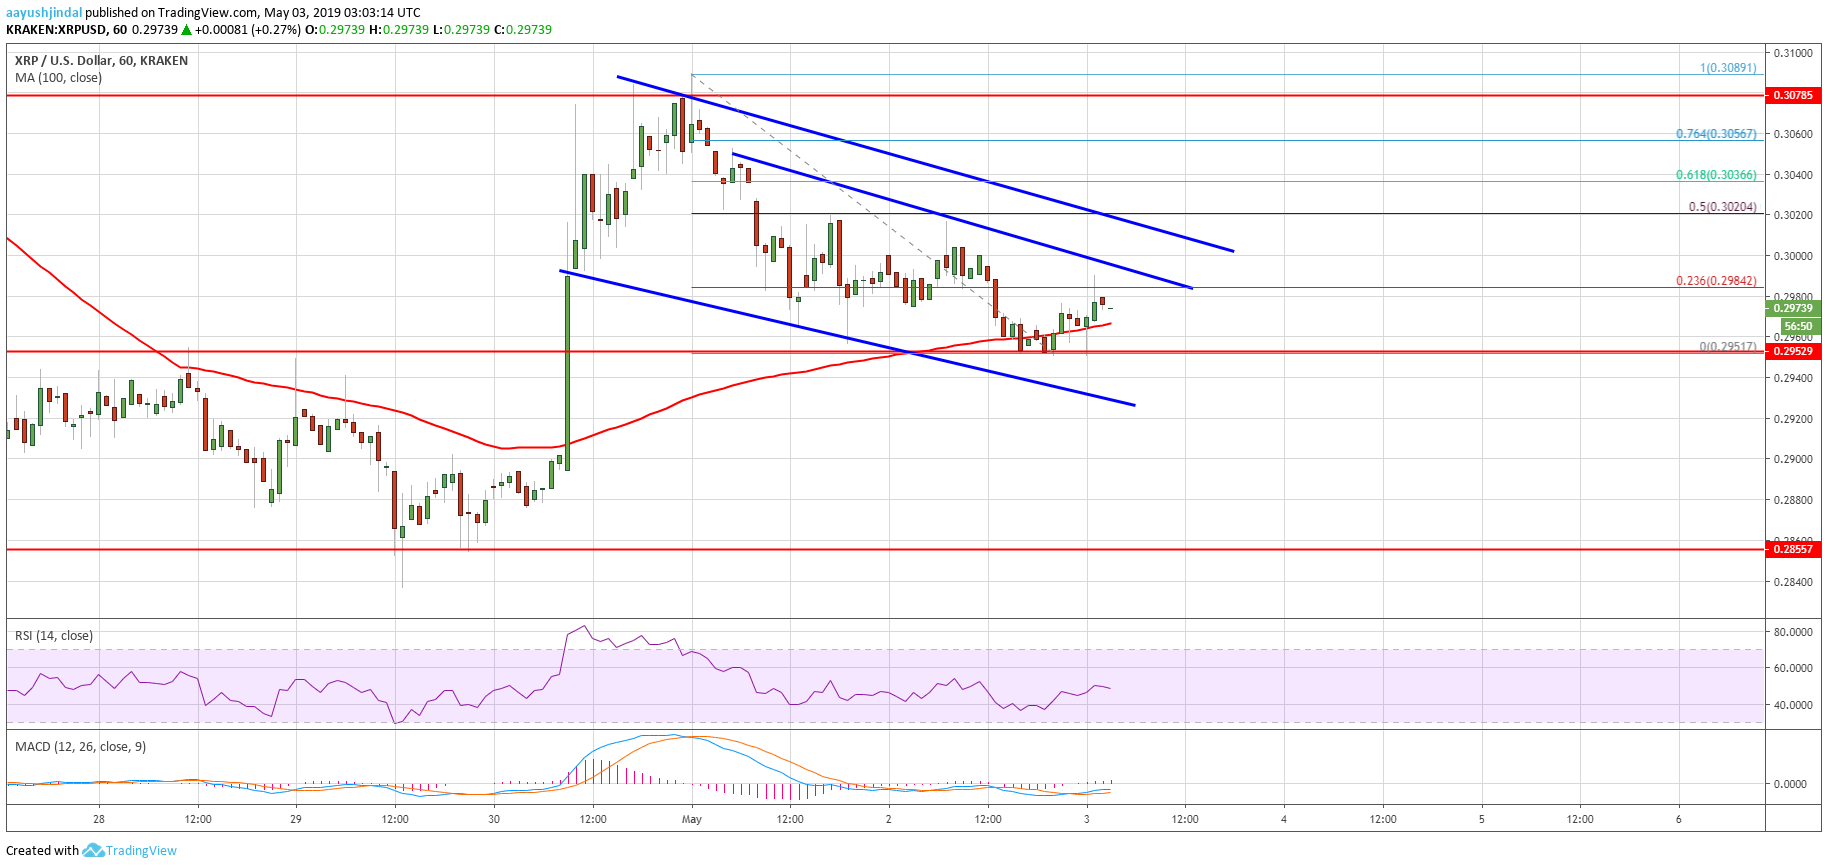
- Ripple price is holding the main $0.2950 support area against the US dollar.
- The price is likely to recover in the near term and it could trade towards $0.3080 or $0.3100.
- There is a declining channel in place with resistance near $0.3010 on the hourly chart of the XRP/USD pair (data source from Kraken).
- The pair is likely to climb higher as long as it is above the $0.2950 support area.
Ripple price is currently trading in a range against the US Dollar, but lost ground vs bitcoin. XRP might start a strong upward move if it clears $0.3020 and $0.3040.
Ripple Price Analysis
In the past two days, there was a steady decline in ripple price from the $0.3089 swing high against the US Dollar. The XRP/USD pair broke the $0.3040 and $0.3000 support levels. It even broke the $0.2980 level and tested the next key support near $0.2950, where buyers emerged. The 50% Fib retracement level of the upward move from the $0.2834 low to $0.3089 high also acted as a support. As a result, there were a couple of swing moves and the price remained above the $0.2950 support.
On the upside, an initial resistance is near $0.2985, and the 23.6% Fib retracement level of the recent decline from the $0.3089 high to $0.2951 low. However, the main resistance is near the $0.3000 and $0.3010 levels. There is also a declining channel in place with resistance near $0.3010 on the hourly chart of the XRP/USD pair. Above the channel resistance, the $0.3020 level could prevent gains. It represents the 50% Fib retracement level of the recent decline from the $0.3089 high to $0.2951 low.
If there is a successful close above $0.3000 and $0.3020, the price could start a strong upward move. The next resistance is near $0.3040, above which the price may revisit the $0.3089 swing high. On the downside, the $0.2950 support holds the key. If there is a bearish break below $0.2950, the price may perhaps decline sharply towards $0.2900 or $0.2880.
Looking at the chart, ripple price is likely to grind higher considering the current market sentiment for bitcoin. A few other altcoins are gaining momentum, therefore, XRP price might also start a decent upward move. Having said that, the bulls need to pierce the $0.3020 resistance with a follow through above $0.3040 to challenge the $0.3100 or $0.3120 level.
Technical Indicators
Hourly MACD – The MACD for XRP/USD is slowly moving in the bullish zone.
Hourly RSI (Relative Strength Index) – The RSI for XRP/USD is still below the 50 level, with a minor bearish angle.
Major Support Levels – $0.2960, $0.2950 and $0.2910.
Major Resistance Levels – $0.3000, $0.3020 and $0.3040.


