
Reason to trust
How Our News is Made
Strict editorial policy that focuses on accuracy, relevance, and impartiality
Ad discliamer
Morbi pretium leo et nisl aliquam mollis. Quisque arcu lorem, ultricies quis pellentesque nec, ullamcorper eu odio.
- Ripple price remained in a bearish zone and failed to recover above $0.2980 against the US dollar.
- The price is currently trading near the $0.2910 support and remains at a risk of more losses.
- This week’s highlighted bearish trend line is still intact with resistance near $0.2950 on the hourly chart of the XRP/USD pair (data source from Kraken).
- The pair is currently under pressure and it could spike below the $0.2900 support before a fresh increase.
Ripple price is struggling to start a rebound against the US Dollar and declined versus bitcoin. XRP must break the $0.2950 and $0.2980 resistance levels to start a strong upward move.
Ripple Price Analysis
Recently, there was an upward move from the $0.2910 support area in ripple price against the US Dollar. The XRP/USD pair traded above the $0.2950 and $0.2960 resistance levels. The price even tested the $0.3000 level, but it failed to retain gains. As a result, there was a fresh decline below the $0.2980 level and the 100 hourly simple moving average. There was a clear failed attempt near $0.3000 and the price is currently trading well below the $0.2950 level.
It traded to a new weekly low at $0.2901 and it remains at a risk of more losses. Recently, there were a couple of swing moves above the 23.6% Fib retracement level of the last drop from the $0.2996 high to $0.2901 low. However, the broken support near the $0.2950 level acted as a resistance. Besides, the 50% Fib retracement level of the last drop from the $0.2996 high to $0.2901 low capped the upward move. More importantly, this week’s highlighted bearish trend line is still intact with resistance near $0.2950 on the hourly chart of the XRP/USD pair.
Therefore, there is a strong resistance formed near the $0.2950 and $0.2960 levels. The next resistance is near the $0.2980 level and the 100 hourly SMA. A successful close above the $0.2980 and $0.3000 levels is must for the bulls to gain traction. Above $0.3000, the main resistance is near the $0.3080 level.
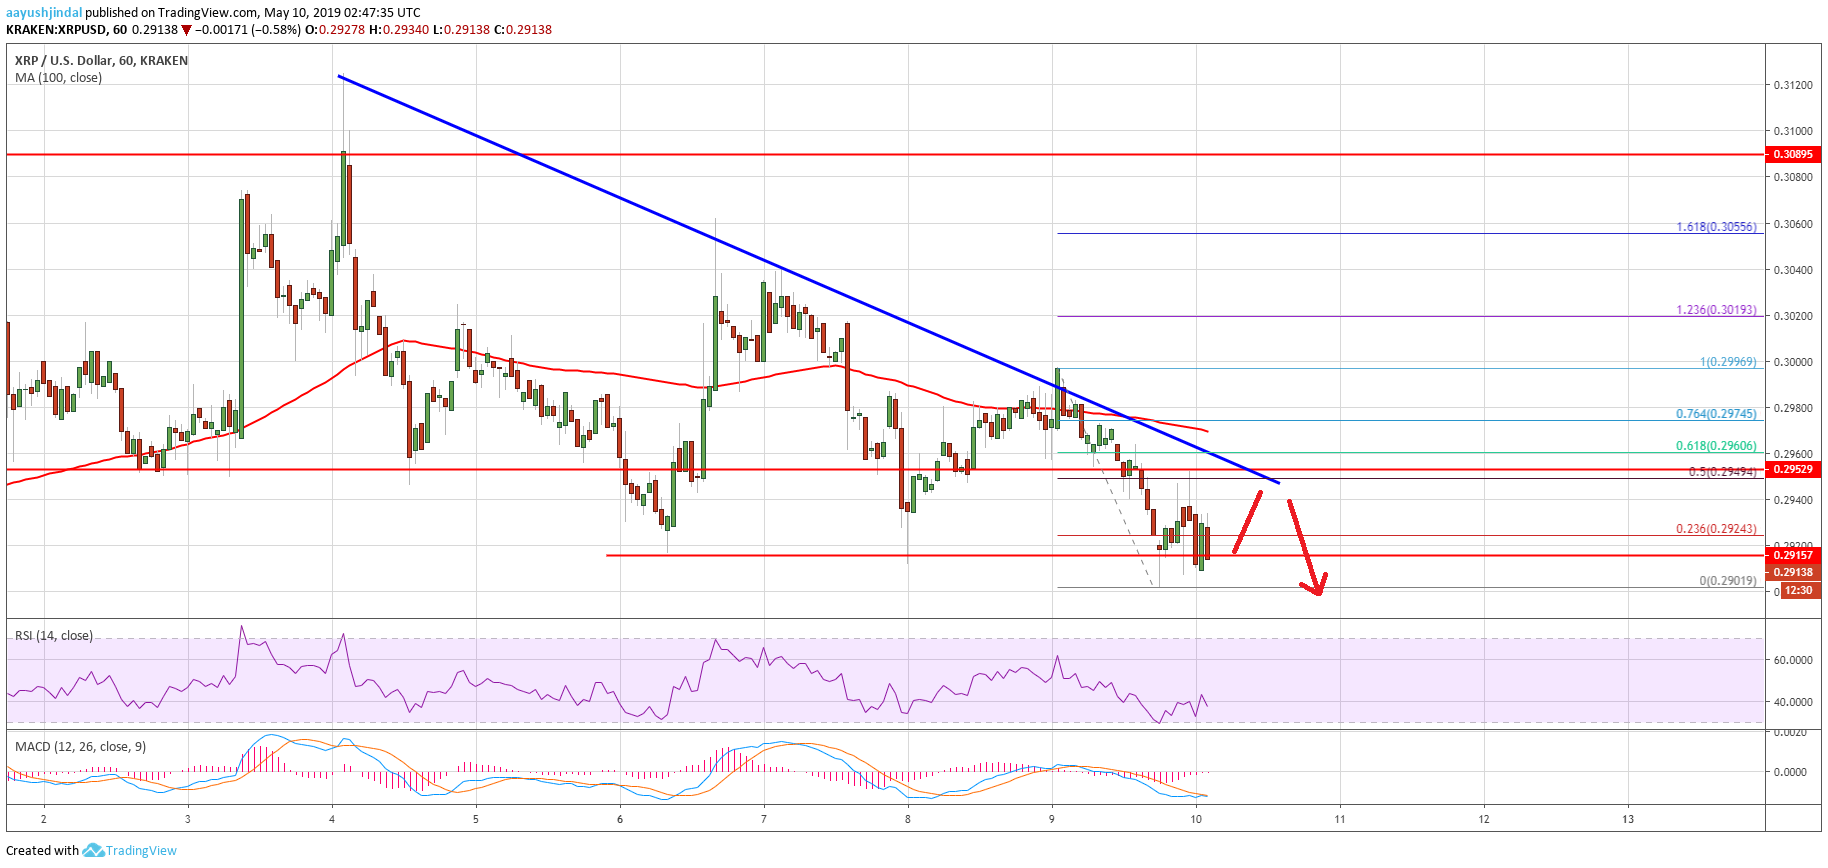
Looking at the chart, ripple price is clearly struggling to gain traction above $0.3000 despite strong bullish moves in bitcoin above $6,200. Therefore, there is a risk of more losses below the $0.2910 and $0.2900 support levels in the near term. The next important support for the bulls could be $0.2850 (the previous swing low).
Technical Indicators
Hourly MACD – The MACD for XRP/USD is about to move back in the bullish zone.
Hourly RSI (Relative Strength Index) – The RSI for XRP/USD is currently well below the 50 level, with a bearish bias.
Major Support Levels – $0.2910, $0.2900 and $0.2850.
Major Resistance Levels – $0.2950, $0.2980 and $0.3000.


