
Reason to trust
How Our News is Made
Strict editorial policy that focuses on accuracy, relevance, and impartiality
Ad discliamer
Morbi pretium leo et nisl aliquam mollis. Quisque arcu lorem, ultricies quis pellentesque nec, ullamcorper eu odio.
- Ripple price struggled to clear the $0.3320 resistance and declined steadily against the US dollar.
- The price declined below the $0.3200 support area and revisited the $0.3175 support area.
- There are two bearish trend lines in place with resistance at $0.3260 and $0.3280 on the hourly chart of the XRP/USD pair (data source from Kraken).
- The pair remains at a huge risk of more losses if there is a break below the $0.3175 and $0.3160 supports.
Ripple price failed to gain strength against the US Dollar despite positive moves in bitcoin. XRP declined below $0.3225 and $0.3200, and it is currently trading with a strong bearish bias.
Ripple Price Analysis
Yesterday, we saw a decent upward move in ripple price above $0.3250 against the US Dollar. The XRP/USD pair climbed above the $0.3280 and $0.3300 resistance levels. BTC’s rise above the $5,500 level helped XRP in moving past $0.3300, but it struggled to gain strength above the $0.3320 resistance level. As a result, there was a fresh declined below the $0.3280 support and the 100 hourly simple moving average. The price even traded below the $0.3200 support level and tested the key $0.3175 support.
It is currently consolidating above $0.3175, with a strong bearish bias. On the upside, an initial resistance is near the $0.3228 level. It represents the 50% Fib retracement level of the recent slide from the $0.3282 high to $0.3174 low. There are also two bearish trend lines in place with resistance at $0.3260 and $0.3280 on the hourly chart of the XRP/USD pair. The first trend line also coincides with the 100 hourly SMA and the 76.4% Fib retracement level of the recent slide from the $0.3282 high to $0.3174 low.
Therefore, it won’t be easy for the bulls to gain traction above the $0.3260 and $0.3280 resistance levels. If there is a downside break below the $0.3175 support, there could be sharp losses. An initial support is at $0.3160, below which the price could decline heavily towards the $0.3100 or $0.3060 level.
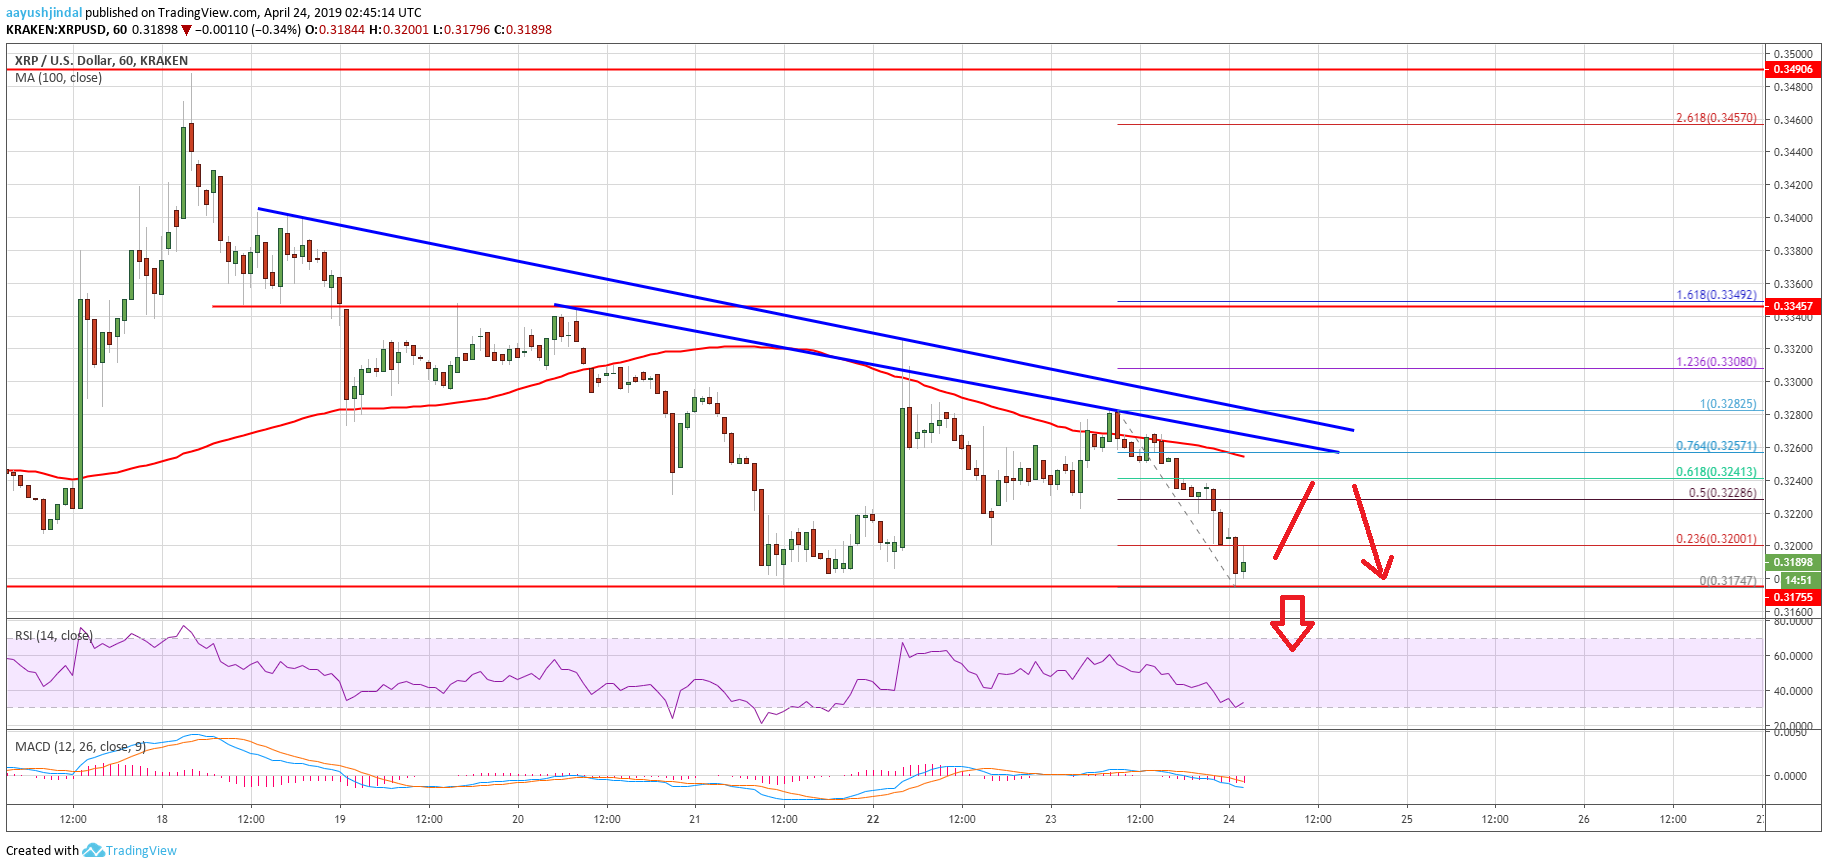
Looking at the chart, ripple price is clearly trading in a bearish zone below the $0.3250, $0.3260 and $0.3280 levels. Until there is a close above $0.3300, there remains a risk of a sharp drop in the near term. An immediate hope for the bulls is at $0.3160, below which there is mostly an open space up to $0.3060.
Technical Indicators
Hourly MACD – The MACD for XRP/USD is gaining strength in the bearish zone, with a negative bias.
Hourly RSI (Relative Strength Index) – The RSI for XRP/USD is now well below the 40 level and testing 30.
Major Support Levels – $0.3175, $0.3160 and $0.3100.
Major Resistance Levels – $0.3260, $0.3280 and $0.3300.


