
Reason to trust
How Our News is Made
Strict editorial policy that focuses on accuracy, relevance, and impartiality
Ad discliamer
Morbi pretium leo et nisl aliquam mollis. Quisque arcu lorem, ultricies quis pellentesque nec, ullamcorper eu odio.
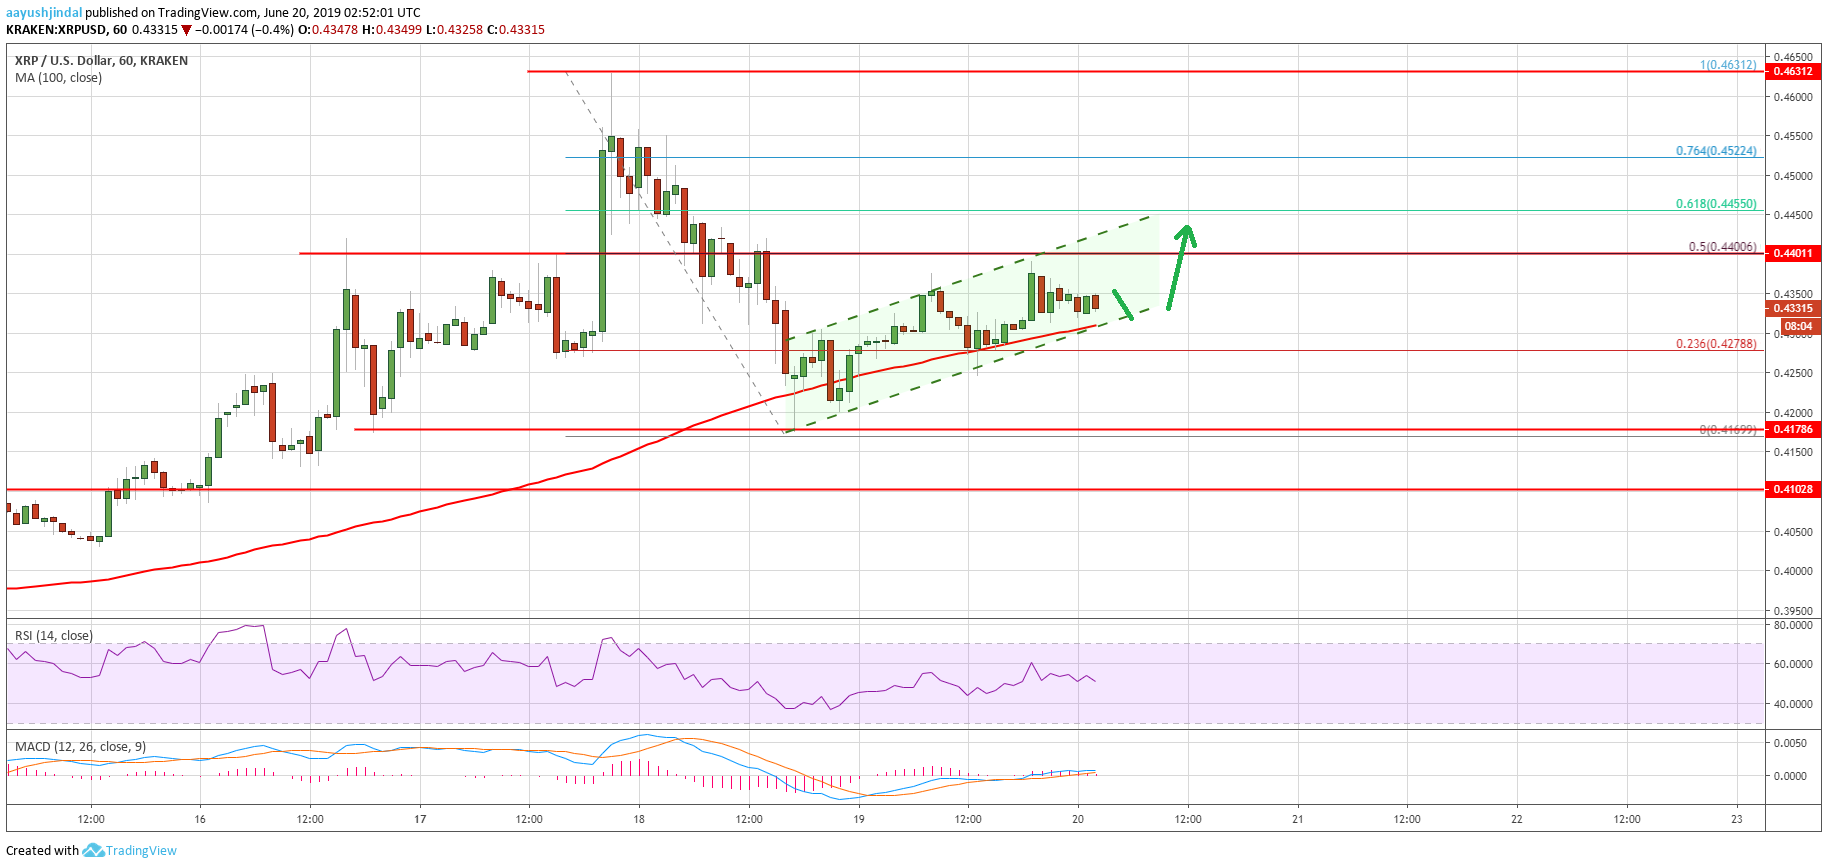
- Ripple price started a major downside correction after a strong rally above $0.4600 against the US dollar.
- The price tested the $0.4175 support area and it is currently recovering above $0.4300.
- There is a rising channel forming with support near $0.4300 on the hourly chart of the XRP/USD pair (data source from Kraken).
- The pair is likely to face a strong resistance near the $0.4400 and $0.4450 levels in the near term.
Ripple price is currently moving higher against the US Dollar, but consolidating vs bitcoin. XRP could gain momentum once it clears the $0.4400 and $0.4450 resistance levels.
Ripple Price Analysis
Recently, we saw a major rally in ripple price above the $0.4500 resistance against the US Dollar. The XRP/USD pair surpassed the $0.4600 level and traded to a new weekly high near $0.4630. Recently, it started a downside correction and traded sharply below $0.4500 and $0.4400. The price even traded below the $0.4250 level and tested the $0.4175 level.
A swing low was formed at $0.4169 and the price recently started a fresh increase. It settled above the $0.4300 level and the 100 hourly simple moving average. Moreover, there was a break above the 23.6% Fib retracement level of the last slide from the $0.4630 swing high to $0.4170 swing low. However, the price seems to be facing a strong resistance near the $0.4400 level.
The 50% Fib retracement level of the last slide from the $0.4630 swing high to $0.4170 swing low is also near the $0.4400 level. If there is an upside break, the price could test the next key resistance at $0.4450. It coincides with the 61.8% Fib retracement level of the last slide from the $0.4630 swing high to $0.4170 swing low.
On the downside, there are many supports near the $0.4300 level. Moreover, there is a rising channel forming with support near $0.4300 on the hourly chart of the XRP/USD pair. If the pair fails to stay above the channel support, it could decline again below $0.4250. The main support on the downside is near the $0.4200 and $0.4175 levels.
Looking at the chart, ripple price is slowly recovering above the $0.4300 level. However, the bulls need to gain pace above the $0.4400 resistance to push the price into a positive zone. If there are more gains, the next stop for them could be $0.4450 or even $0.4500 in the near term.
Technical Indicators
Hourly MACD – The MACD for XRP/USD is currently moving slowly in the bullish zone.
Hourly RSI (Relative Strength Index) – The RSI for XRP/USD is back above the 50 level, with a positive angle.
Major Support Levels – $0.4300, $0.4250 and $0.4200.
Major Resistance Levels – $0.4400, $0.4450 and $0.4500.


