
Reason to trust
How Our News is Made
Strict editorial policy that focuses on accuracy, relevance, and impartiality
Ad discliamer
Morbi pretium leo et nisl aliquam mollis. Quisque arcu lorem, ultricies quis pellentesque nec, ullamcorper eu odio.
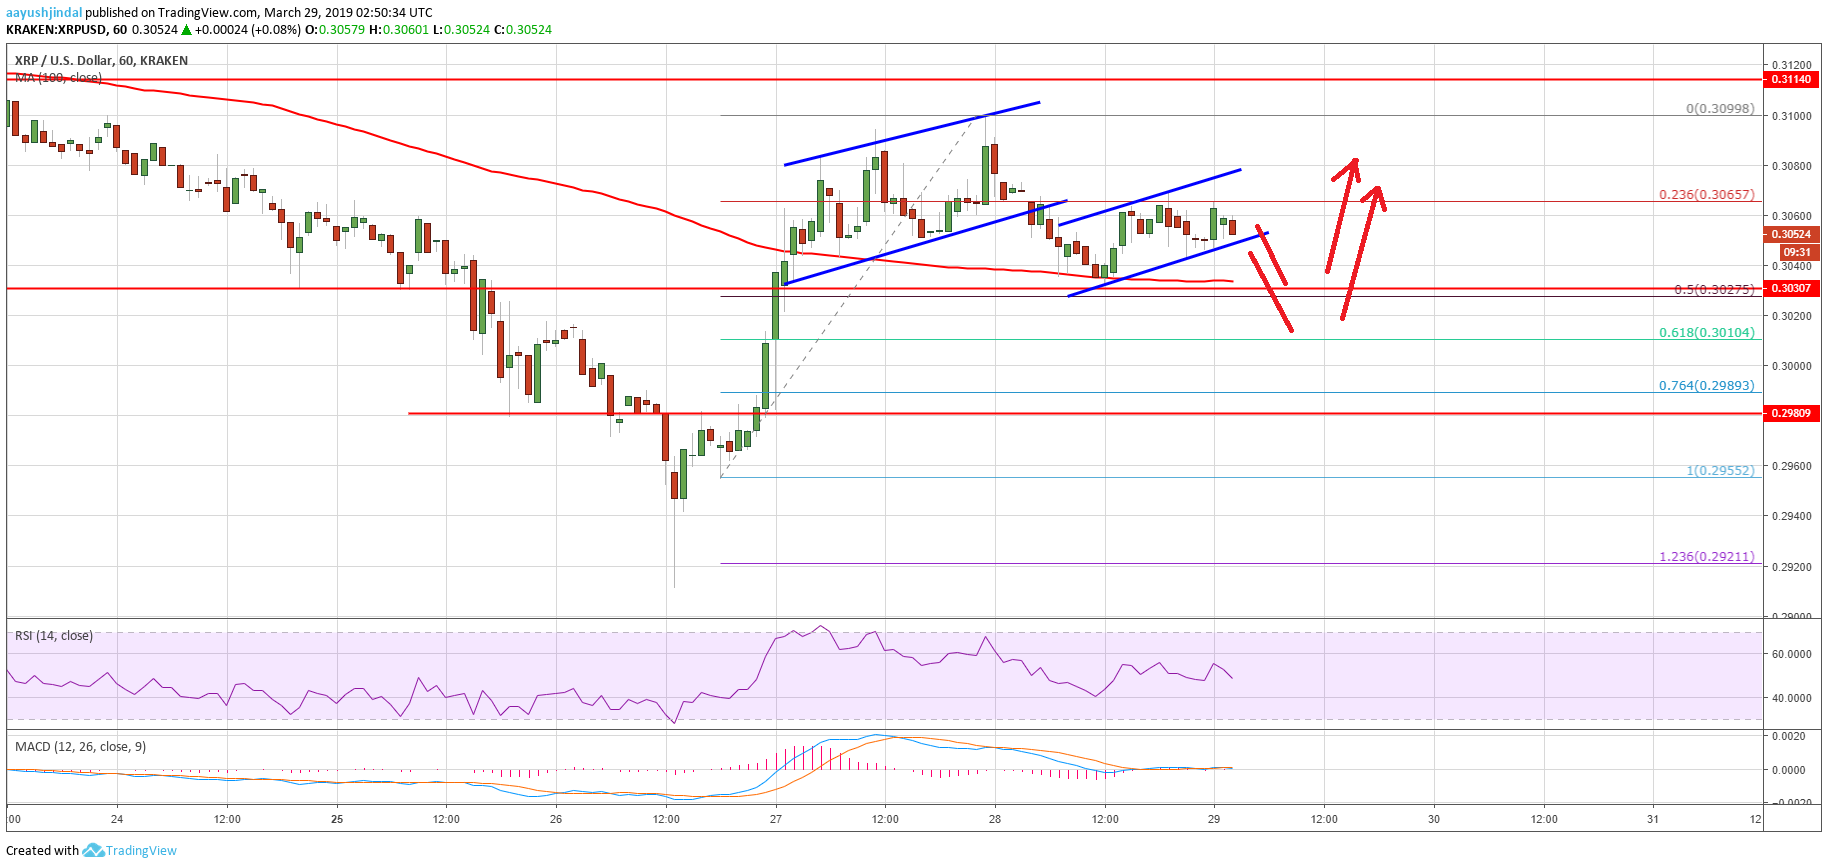
- Ripple price started a downside correction after testing the $0.3100 resistance against the US dollar.
- The price traded below the $0.3080, $0.3065 and $0.3060 support levels.
- A replica of the previous ascending channel is formed with support at $0.3050 on the hourly chart of the XRP/USD pair (data source from Kraken).
- The pair is likely to extend the correction towards the $0.3025 support before a fresh increase.
Ripple price corrected lower recently from important resistances against the US Dollar and bitcoin. XRP/USD is likely to find a strong buying interest on dips near $0.3025 and $0.3010.
Ripple Price Analysis
Recently, we saw a solid rebound in ripple price above the $0.3000 pivot level against the US Dollar. The XRP/USD pair even settled above the $0.3025 resistance and the 100 hourly simple moving average. There was an upside extension above the $0.3065 and $0.3080 levels. However, the price faced a strong selling interest near the $0.3100 level. A swing high was formed at $0.3099 and later the price started a downside correction.
It corrected below the $0.3080 support and the 23.6% Fib retracement level of the last leg from the $0.2955 low to $0.3100 swing high. Later, there was a break below a short term ascending channel $0.3065 on the hourly chart of the XRP/USD pair. Finally, there was a break towards the $0.3025 support and the 100 hourly SMA. The price traded close to the 50% Fib retracement level of the last leg from the $0.2955 low to $0.3100 swing high. At the outset, the price is rebounding and trading above the $0.3040 level.
More importantly, a replica of the previous ascending channel is formed with support at $0.3050 on the same chart. Therefore, there are chances of another dip towards the $0.3025 support and the 100 hourly SMA. If there are more losses, the next support is near the $0.3010 level. It represents the 61.8% Fib retracement level of the last leg from the $0.2955 low to $0.3100 swing high.
Looking at the chart, ripple price might dip in the short term, but it remains supported near the $0.3025 and $0.3010 levels. The next main support is at $0.3000, below which the price may move back in a bearish zone. On the upside, an initial resistance is near the $0.3080 level. An upside extension could lead the price towards the $0.3100 resistance. Finally, a break above $0.3100 is likely to push the price towards $0.3200.
Technical Indicators
Hourly MACD – The MACD for XRP/USD is currently flat in the bullish zone.
Hourly RSI (Relative Strength Index) – The RSI for XRP/USD is currently moving lower towards the 50 level.
Major Support Levels – $0.3050, $0.3025 and $0.3010.
Major Resistance Levels – $0.3080, $0.3095 and $0.3100.


