
Reason to trust
How Our News is Made
Strict editorial policy that focuses on accuracy, relevance, and impartiality
Ad discliamer
Morbi pretium leo et nisl aliquam mollis. Quisque arcu lorem, ultricies quis pellentesque nec, ullamcorper eu odio.
Ripple failed to clear the $0.3000 barrier and started a strong decline against the US Dollar. XRP price is down over 8% and it seems like the bears are aiming a test of the $0.2500 support.
- Ripple is declining and it is now trading well below the $0.3000 level against the US dollar.
- The price is currently approaching the $0.2750 support and the 100 SMA (H4).
- There is a key bearish trend line forming with resistance near $0.2980 on the 4-hours chart of the XRP/USD pair (data source from Kraken).
- The pair could decline further if there is a close below the $0.2750 and $0.2720 support levels.
Ripple Price Is Showing Bearish Signs
After a couple of failed attempts to clear the $0.3000 resistance, ripple started a fresh decline. The price broke the $0.2920 support level to move into a short-term bearish zone.
The bears gained strength and the price declined below the key $0.2850 support levels. The price even traded below the 50% Fib retracement level of the upward move from the $0.2407 low to $0.3210 high.
Moreover, there is a key bearish trend line forming with resistance near $0.2980 on the 4-hours chart of the XRP/USD pair. Ripple price is now trading near the $0.2780 level and the 100 simple moving average (4-hours).
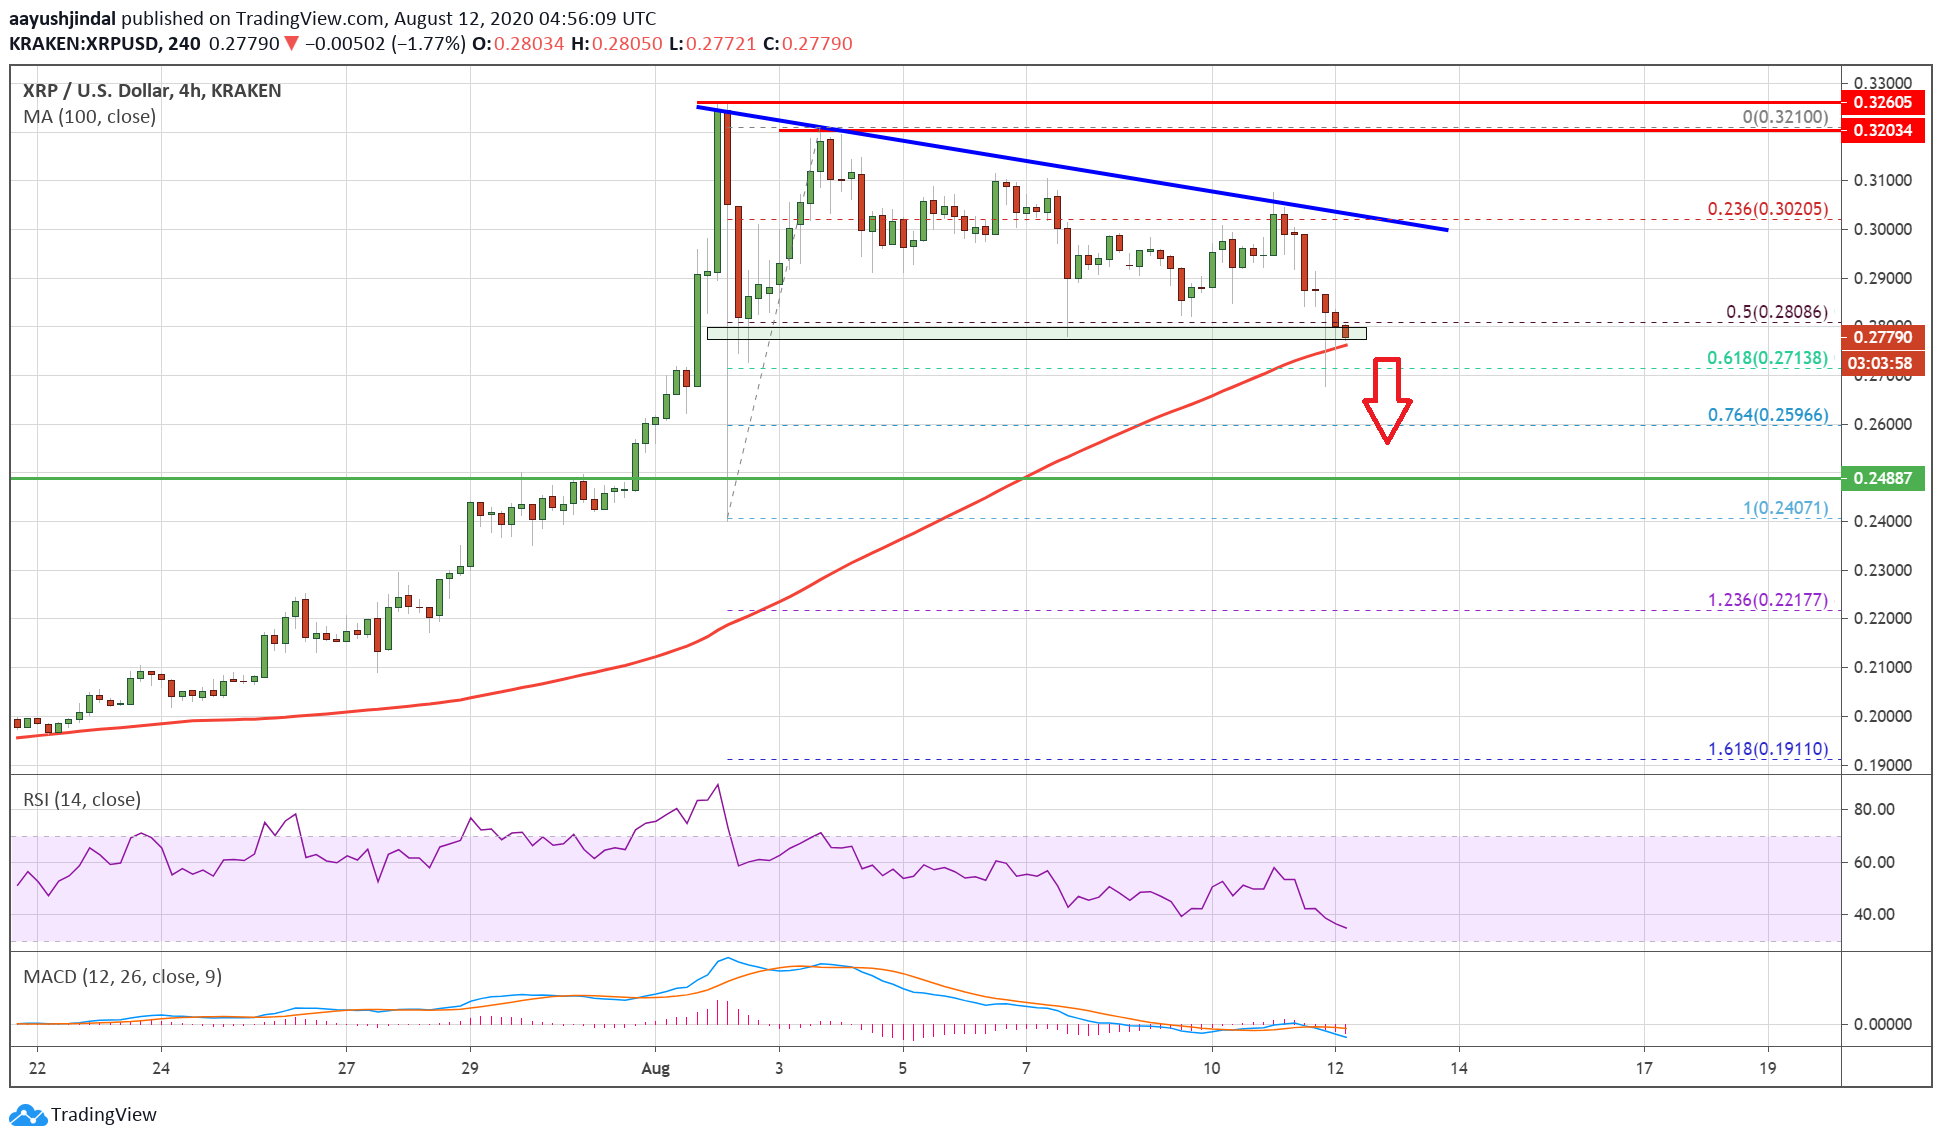
Ripple (XRP) price trades below $0.2850. Source: TradingView.com
If there is a downside break, the price could continue to move down towards the $0.2720 support. The 61.8% Fib retracement level of the upward move from the $0.2407 low to $0.3210 high is also near the $0.2715 level.
A downside break below the $0.2720 and $0.2700 support levels, the price could continue to move down. The next major support is seen near the $0.2500 level (the last major breakout zone). Ant further losses may perhaps push the price back into a bearish zone.
Reversal in XRP?
If ripple stays above the 100 SMA (H4) or the $0.2720 support zone, the price could start a fresh increase. The first major resistance zone is near the $0.2850 level.
The main hurdle is still near the $0.3000 level and the bearish trend line. A successful close above the $0.3000 level is needed for a strong upward move in the coming sessions.
Technical Indicators
4-Hours MACD – The MACD for XRP/USD is now gaining strength in the bearish zone.
4-Hours RSI (Relative Strength Index) – The RSI for XRP/USD is now well below the 50 level.
Major Support Levels – $0.2750, $0.2720 and $0.2500.
Major Resistance Levels – $0.2850, $0.2920 and $0.3000.


