
Reason to trust
How Our News is Made
Strict editorial policy that focuses on accuracy, relevance, and impartiality
Ad discliamer
Morbi pretium leo et nisl aliquam mollis. Quisque arcu lorem, ultricies quis pellentesque nec, ullamcorper eu odio.
Ripple is showing signs of a decent recovery above $0.1400 against the US Dollar. XRP price could attempt to surpass the $0.1650 resistance and start a strong rise.
- Ripple price is facing a couple of key hurdles near $0.1620 and $0.1650 against the US dollar.
- A key support base seems to be forming near the $0.1400 area.
- There is an important contracting triangle forming with resistance near $0.1650 on the hourly chart of the XRP/USD pair (data source from Kraken).
- The price might attempt to start a strong rise above the $0.1600 and $0.1650 resistance levels.
Ripple Price Forming Support Base
After crumbling towards the $0.1150 area, ripple started an upside correction. XRP price recovered above the $0.1250 and $0.1400 resistance levels to start a decent recovery.
There was a clear break above the 23.6% Fib retracement level of the main drop from the $0.2102 high to $0.1166 low. However, the price is facing a strong resistance near the $0.1600 area and the 100 hourly simple moving average.
The 50% Fib retracement level of the main drop from the $0.2102 high to $0.1166 low is also acting as a key hurdle for the bulls. More importantly, there is an important contracting triangle forming with resistance near $0.1650 on the hourly chart of the XRP/USD pair.
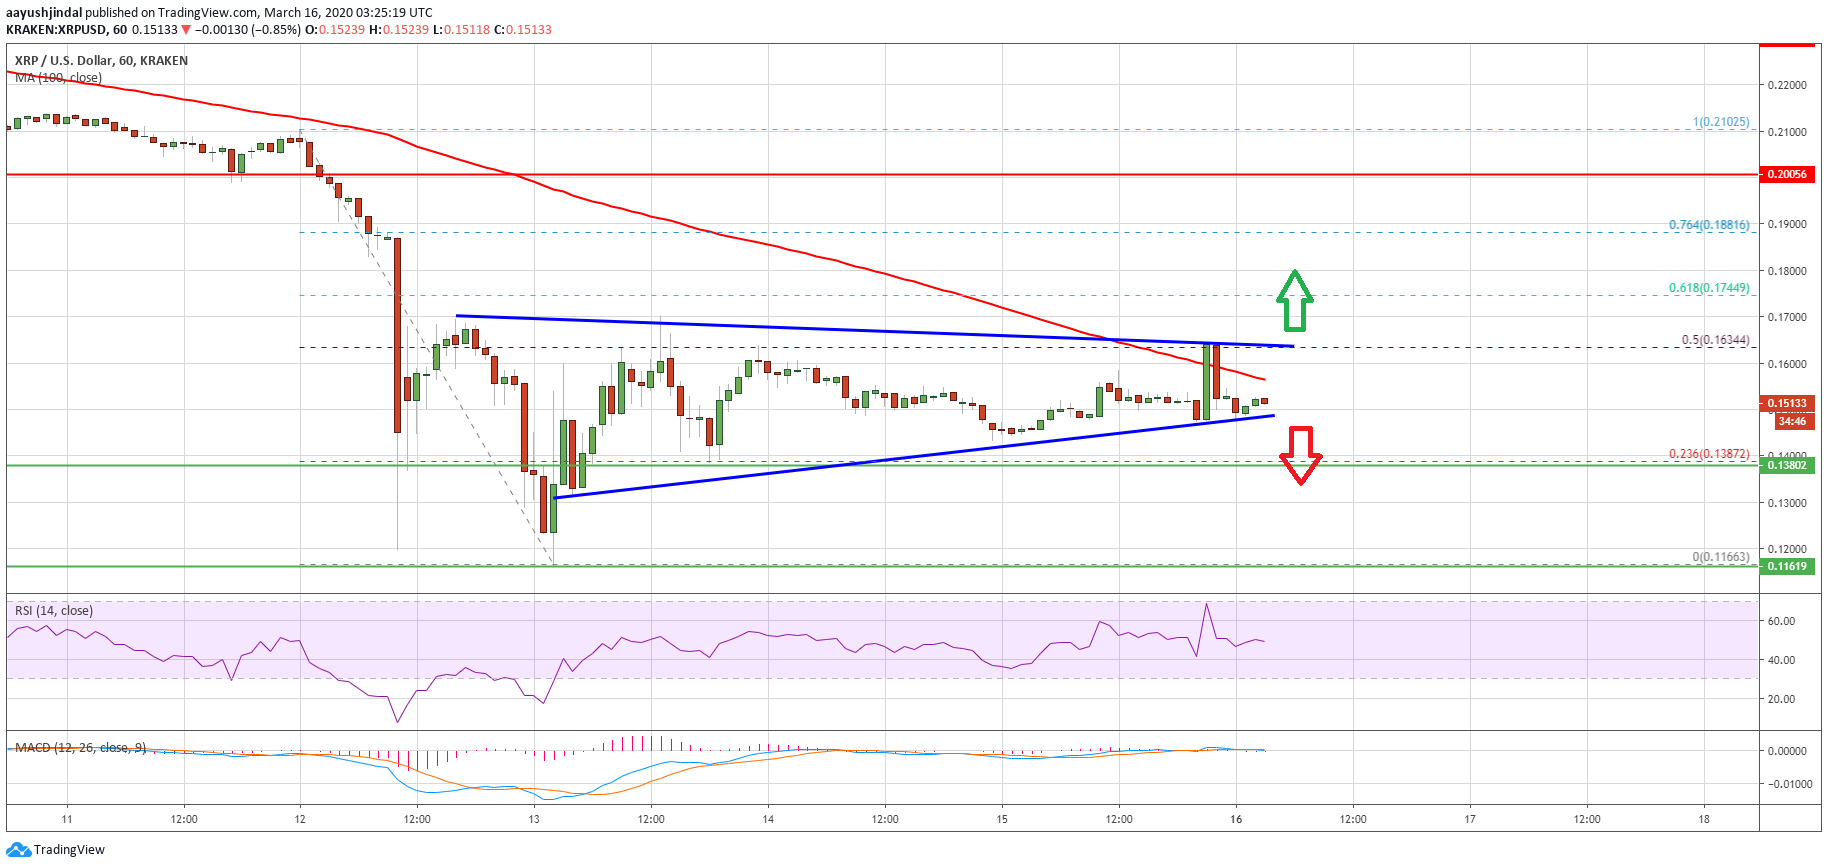
It seems like there is a major breakout zone forming near the $0.1600 area. If there is an upside break above the $0.1620 and $0.1650 resistance levels, there are chances of a strong rise in the near term.
The next key resistance is near the $0.1750 area, plus the 61.8% Fib retracement level of the main drop from the $0.2102 high to $0.1166 low.
Breakdown Zone
If ripple price struggles to clear the $0.1600 resistance, it could start another decline. On the downside, an initial support is near the $0.1450 level. The first major support is near the $0.1385 area, below which the bears are likely to take control.
In the mentioned bearish scenario, the price is likely to revisit the $0.1200 support area in the coming sessions. Any further losses are likely to open the doors for more downsides towards $0.1100.
Technical Indicators
Hourly MACD – The MACD for XRP/USD is now gaining pace in the bearish zone.
Hourly RSI (Relative Strength Index) – The RSI for XRP/USD is still below the 50 level.
Major Support Levels – $0.1450, $0.1400 and $0.1380.
Major Resistance Levels – $0.1600, $0.1620 and $0.1650.


