
Reason to trust
How Our News is Made
Strict editorial policy that focuses on accuracy, relevance, and impartiality
Ad discliamer
Morbi pretium leo et nisl aliquam mollis. Quisque arcu lorem, ultricies quis pellentesque nec, ullamcorper eu odio.
Ripple started a downside correction from the $0.2110 resistance region against the US Dollar. XRP price seems to be following a bullish flag pattern and it could resume its rally above $0.2000 and $0.2100.
- Ripple price is correcting lower from the $0.2118 swing high against the US dollar.
- The price is trading nicely above the $0.1900 support and the 100 simple moving average (4-hours).
- There is a major bullish flag forming with resistance near $0.2050 on the 4-hours chart of the XRP/USD pair (data source from Kraken).
- The pair is likely to start a fresh rally once it clears the $0.2025 and $0.2050 resistance levels.
Ripple Price Could Resume Its Rally
This past week, we saw a sharp increase in ripple above the $0.1900 resistance. XRP price even surged above the $0.2000 level and settled well above the 100 simple moving average (4-hours).
It traded to a new monthly high at $0.2118 before starting a downside correction. There was a break below the $0.2050 level, plus the 23.6% Fib retracement level of the upward move from the $0.1741 swing low to $0.2118 high.
The price even spiked below the $0.1950 level, but the $0.1920 level acted as a strong support. More importantly, the 50% Fib retracement level of the upward move from the $0.1741 swing low to $0.2118 high is acting as a significant buy zone.
The bears made two attempts to pierce the $0.1920 support, but they failed. It seems like there is a major bullish flag forming with resistance near $0.2050 on the 4-hours chart of the XRP/USD pair.
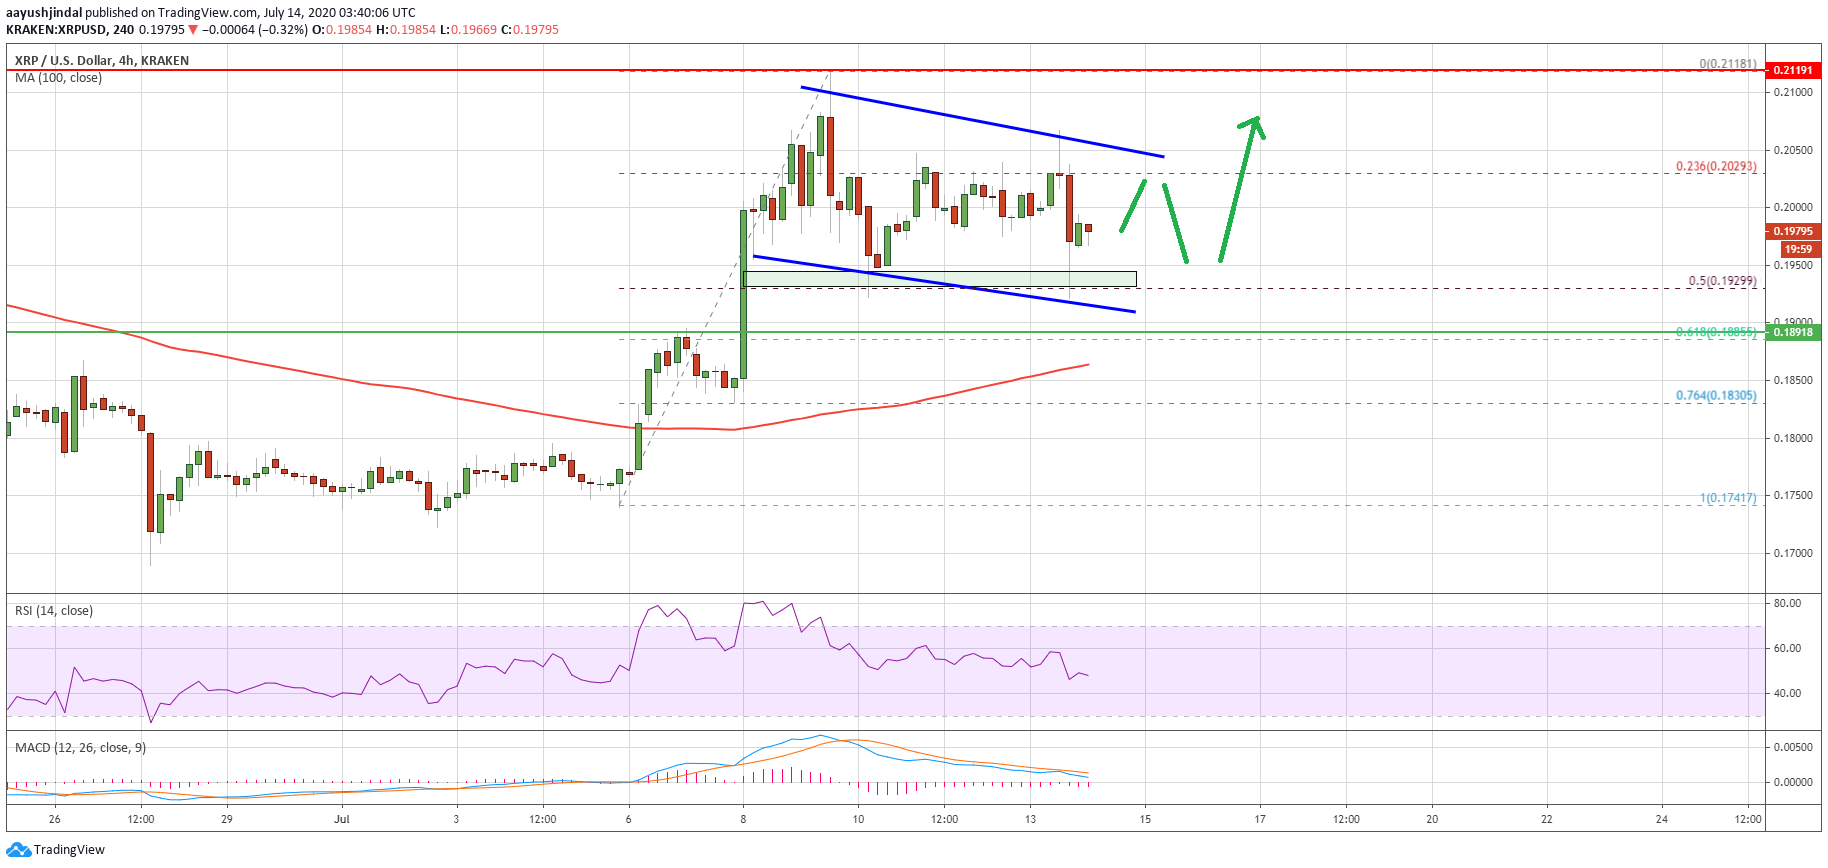
Ripple (XRP) testing $0.1950. Source: TradingView.com
On the upside, the price is facing hurdles near $0.2025 and $0.2050. A successful close above the bullish flag resistance may perhaps restart the rally and the price might surge towards $0.2100. The next target for the bulls could be $0.2200 in the coming sessions.
Bearish Scenario for XRP
If ripple price fails to surpass the $0.2025 and $0.2050 resistance levels, there are chances of a downside extension. The main support on the downside is near the $0.1920 level.
A proper close below the $0.1920 and $0.1900 support levels could spark a sharp decline towards the $0.1750 level. An intermediate support could be $0.1880 or the 100 simple moving average (4-hours).
Technical Indicators
4-Hours MACD – The MACD for XRP/USD is slowly moving back into the bullish zone.
4-Hours RSI (Relative Strength Index) – The RSI for XRP/USD is currently just below the 50 level.
Major Support Levels – $0.1950, $0.1920 and $0.1900.
Major Resistance Levels – $0.2025, $0.2050 and $0.2110.
Take advantage of the trading opportunities with Plus500
Risk disclaimer: 76.4% of retail CFD accounts lose money.


