
Reason to trust
How Our News is Made
Strict editorial policy that focuses on accuracy, relevance, and impartiality
Ad discliamer
Morbi pretium leo et nisl aliquam mollis. Quisque arcu lorem, ultricies quis pellentesque nec, ullamcorper eu odio.
Ripple extended its rise above the $0.2920 resistance against the US Dollar. XRP price even broke the $0.3000 resistance and it is currently correcting gains.
- Ripple is back in a positive zone above the $0.2920 and $0.2950 levels against the US dollar.
- The price traded to a new weekly high at $0.3043 and it is now well above the 100 hourly simple moving average.
- There is a key connecting bullish trend line forming with support near $0.2975 on the hourly chart of the XRP/USD pair (data source from Kraken).
- The pair could correct a few points, but dips are likely to remain supported near $0.2950.
Ripple Price Breaks $0.3000
The recent increase in Ethereum and bitcoin dragged ripple higher above the $0.2920 resistance. XRP climbed above the $0.2950 barrier and settled well above the 100 hourly simple moving average.
Finally, it broke the $0.3000 barrier and traded to a new weekly high at $0.3043. It is currently correcting lower and trading below $0.3020. There was a break below the 23.6% Fib retracement level of the recent rise from the $0.2869 low to $0.3043 high.
The price is now testing the $0.2980 support zone. There is also a key connecting bullish trend line forming with support near $0.2975 on the hourly chart of the XRP/USD pair.
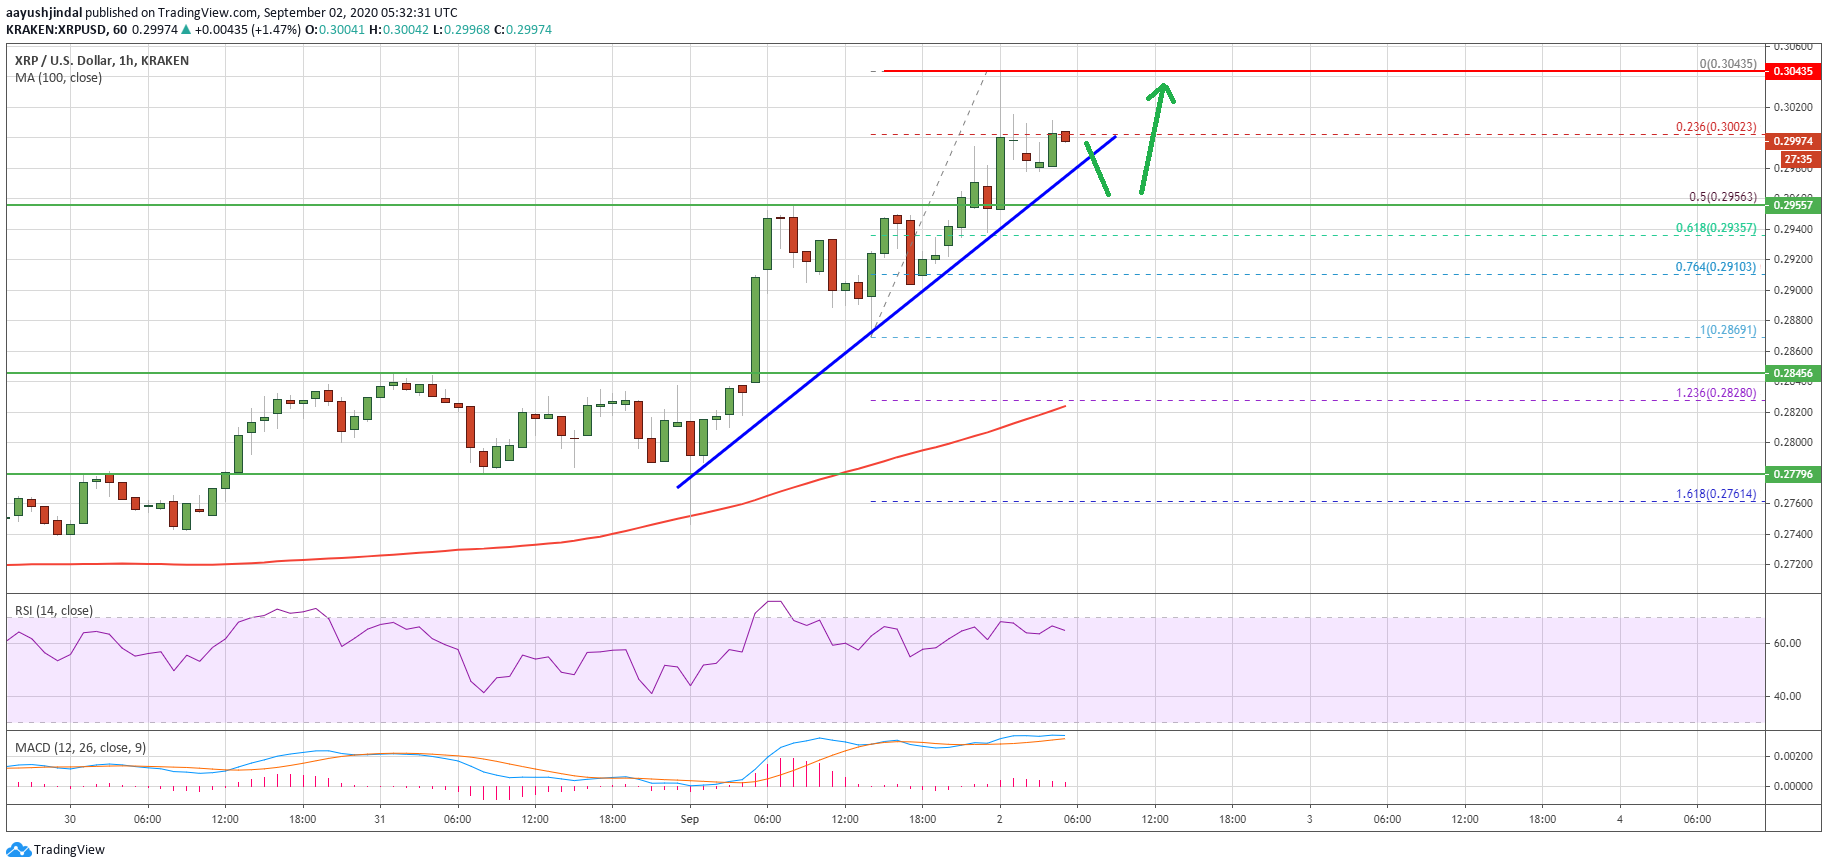
Ripple price trades above $0.3000. Source: TradingView.com
If there is a downside break below the trend line, the price could test the $0.2950 support area. It is important since it is close to the 50% Fib retracement level of the recent rise from the $0.2869 low to $0.3043 high.
On the upside, ripple price is likely to gain pace above the $0.3020 and $0.3040 levels. The first major resistance is near the $0.3080 level, above which the bulls are likely to aim a test of the $0.3120 resistance in the near term.
Dips Limited in XRP?
If ripple starts a downside correction, the bulls are likely to protect the main $0.2950 support zone. The next major support is near the $0.295220 pivot level.
Any further losses are likely to lead the price towards the $0.2850 support level or the 100 hourly simple moving average, where the bulls are likely to take a strong stand.
Technical Indicators
Hourly MACD – The MACD for XRP/USD is slowly losing momentum in the bullish zone.
Hourly RSI (Relative Strength Index) – The RSI for XRP/USD is correcting lower towards the 50 level.
Major Support Levels – $0.2950, $0.2920 and $0.2900.
Major Resistance Levels – $0.3020, $0.3040 and $0.3080.


