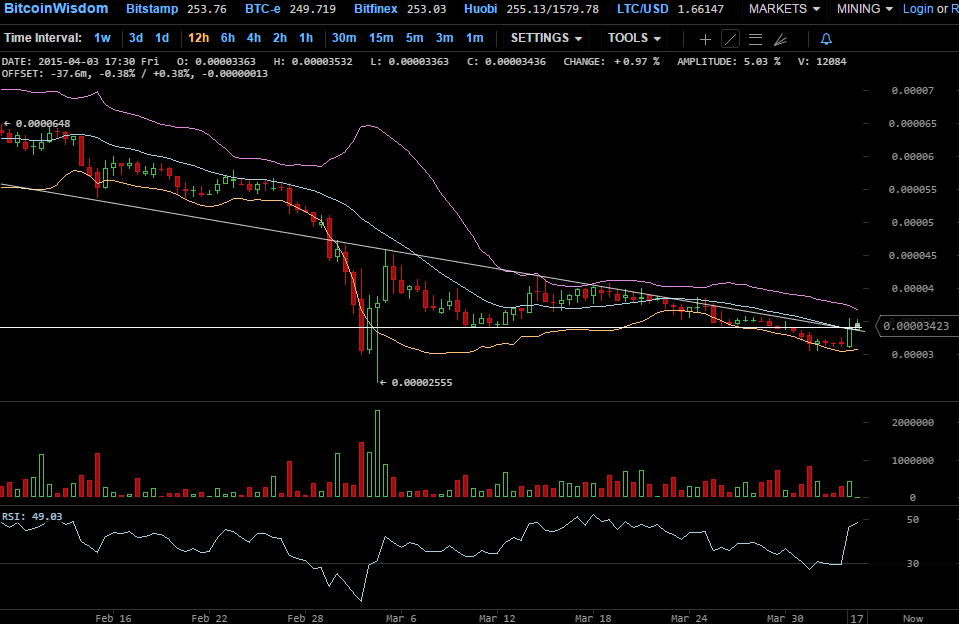
Ripple is trying hard to pare the hefty losses incurred in March when the cryptocurrency declined roughly 50% from 0.00005BTC to a low of 0.00002555BTC before closing the month at 0.00003150BTC. But April has been positive for Ripple until now, with the value gaining up to 0.00003423BTC.
But will the upmove sustain or are there major hurdles ahead? Let’s analyze the 12-hour XRP/BTC price chart to figure out key technical levels and the best trading strategy.
Chart Structure – As can be seen, Ripple had been making successive lower tops lending bears the strength to push the prices down even more. Due to extreme selling pressure, Ripple broke below the crucial support level (drawn as the horizontal line in the chart) of 0.000034BTC. The downward sloping resistance level also added to the pressure, making it incredibly tough for the cryptocurrency to head higher.
But, the bulls seem to be gaining control of the situation as Ripple has crossed above the previous support of 0.000034BTC and is threatening to take out the downward resistance line.
Relative Strength Index – The latest increment has been supported by strength as is evident from the jump in RSI value from 30 to 49.03. The current RSI is near the highs of March and of mid-Feb, and if RSI is able to touch new highs, then the price may as well advance much higher.
Bollinger Bands – Ripple has taken support from the lower range of the Bollinger Band. The 20-12h simple moving average had been acting as a strong resistance level but, if the price is able to float above this resistance of 0.00003363BTC, more gains may follow.
Conclusively, it can be said that bulls have indeed staged a solid comeback however, bullish momentum must be strengthened if the downtrend is to be reversed. Long positions should be built only after the price crosses above the resistance level.
Image: www.miningpool.co.uk