
Reason to trust
How Our News is Made
Strict editorial policy that focuses on accuracy, relevance, and impartiality
Ad discliamer
Morbi pretium leo et nisl aliquam mollis. Quisque arcu lorem, ultricies quis pellentesque nec, ullamcorper eu odio.
Key Highlights
- Ripple price bounced sharply after testing the $0.1800 handle against the US Dollar.
- There was a break above a bearish trend line at $0.1940 on the hourly chart of the XRP/USD pair (data source from Kraken).
- The price traded towards $0.2200 before running into strong sell offers.
Ripple price recovered well intraday against the US Dollar and Bitcoin. XRP/USD is back above $0.1950, but struggling to hold gains.
Ripple Price Support
Yesterday, we saw the start of a new downside move with a break of the $0.1950 support in Ripple price against the US Dollar. The price extended declines and traded towards the $0.1800 level. A low was formed at $0.1800 before the price started an upside move and bounced sharply. During the bounce, there was a break above a bearish trend line at $0.1940 on the hourly chart of the XRP/USD pair.
More importantly, the pair was able to move above the $0.1950 level and the 100 hourly simple moving average. The upside move was strong as there was a break above the $0.2100 resistance. A high was formed at $0.2199 from where the price started a sharp downside correction. It has already breached the 50% Fib retracement level of the last wave from the $0.1800 low to $0.2199 high. However, it is approaching a major support area near $0.1950 and the 100 hourly SMA.
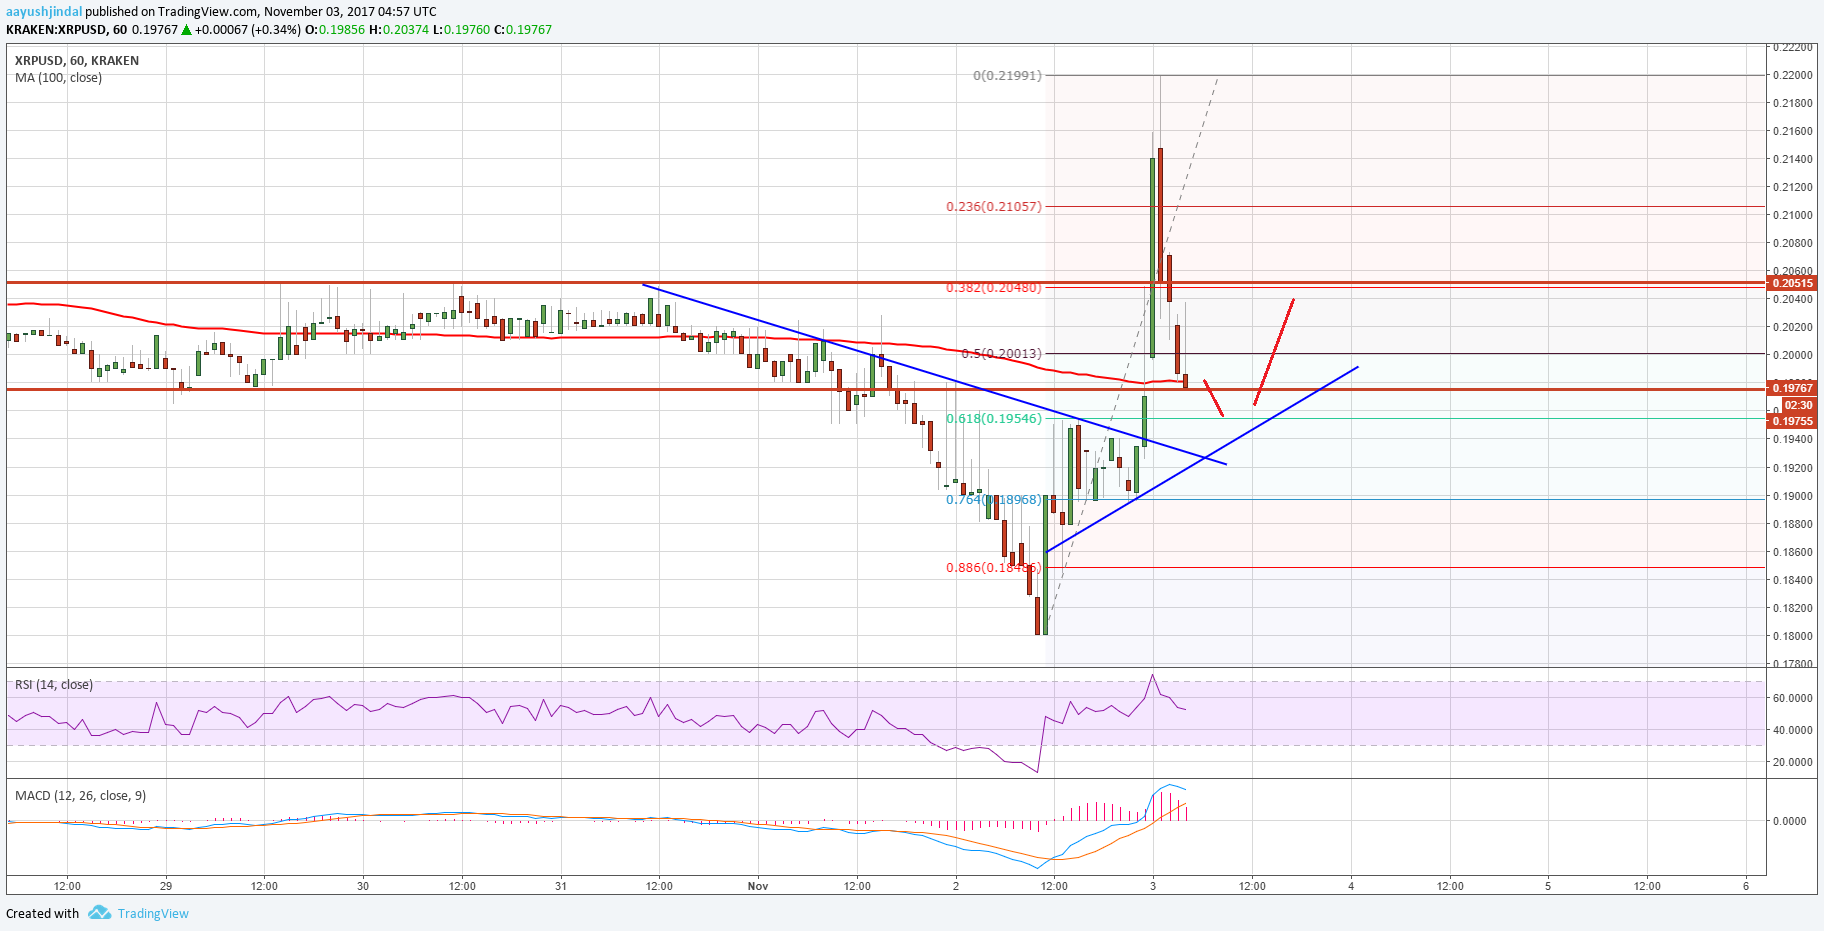
There is also a bullish trend line at $0.1960 and the 61.8% Fib retracement level of the last wave from the $0.1800 low to $0.2199 high at $0.1954. Therefore, once again the $0.1950-0.1960 levels would act as a strong support. The price must stay above $0.1950 to bounce back or it might again test the $0.1850-00 levels.
Looking at the technical indicators:
Hourly MACD – The MACD for XRP/USD is back in the bullish zone.
Hourly RSI (Relative Strength Index) – The RSI for XRP/USD is placed well above the 50 level.
Major Support Level – $0.1950
Major Resistance Level – $0.2100
Charts courtesy – Trading View, Kraken


