
Reason to trust
How Our News is Made
Strict editorial policy that focuses on accuracy, relevance, and impartiality
Ad discliamer
Morbi pretium leo et nisl aliquam mollis. Quisque arcu lorem, ultricies quis pellentesque nec, ullamcorper eu odio.
Key Highlights
- Ripple price is struggling to move above the $0.2050 resistance against the US Dollar.
- There is a new bearish trend line forming with current resistance at $0.2040 on the hourly chart of the XRP/USD pair (data source from Kraken).
- The price might continue to trade in a range with support at $0.1975 and resistance at $0.2040.
Ripple price is trading in a tiny range against the US Dollar and Bitcoin. XRP/USD has to settle above the $0.2050 level to break barriers in the near term.
Ripple Price Range
Yesterday, we saw the start of range trading in Ripple price above the $0.1950 support against the US Dollar. The price remained in the mentioned, but also struggled to break the $0.2050 resistance. There were 2-3 attempts to settle above $0.2050 and $0.2060, but buyers failed. As a result, the price continued to trade in a range and held an important support at $0.1975-0.1960.
On the upside, there is a new bearish trend line forming with current resistance at $0.2040 on the hourly chart of the XRP/USD pair. The trend line resistance is near the 38.2% Fib retracement level of the last decline from the $0.2180 high to $0.1971 low. The 100 hourly simple moving average is also positioned near $0.2040 and the trend line resistance.
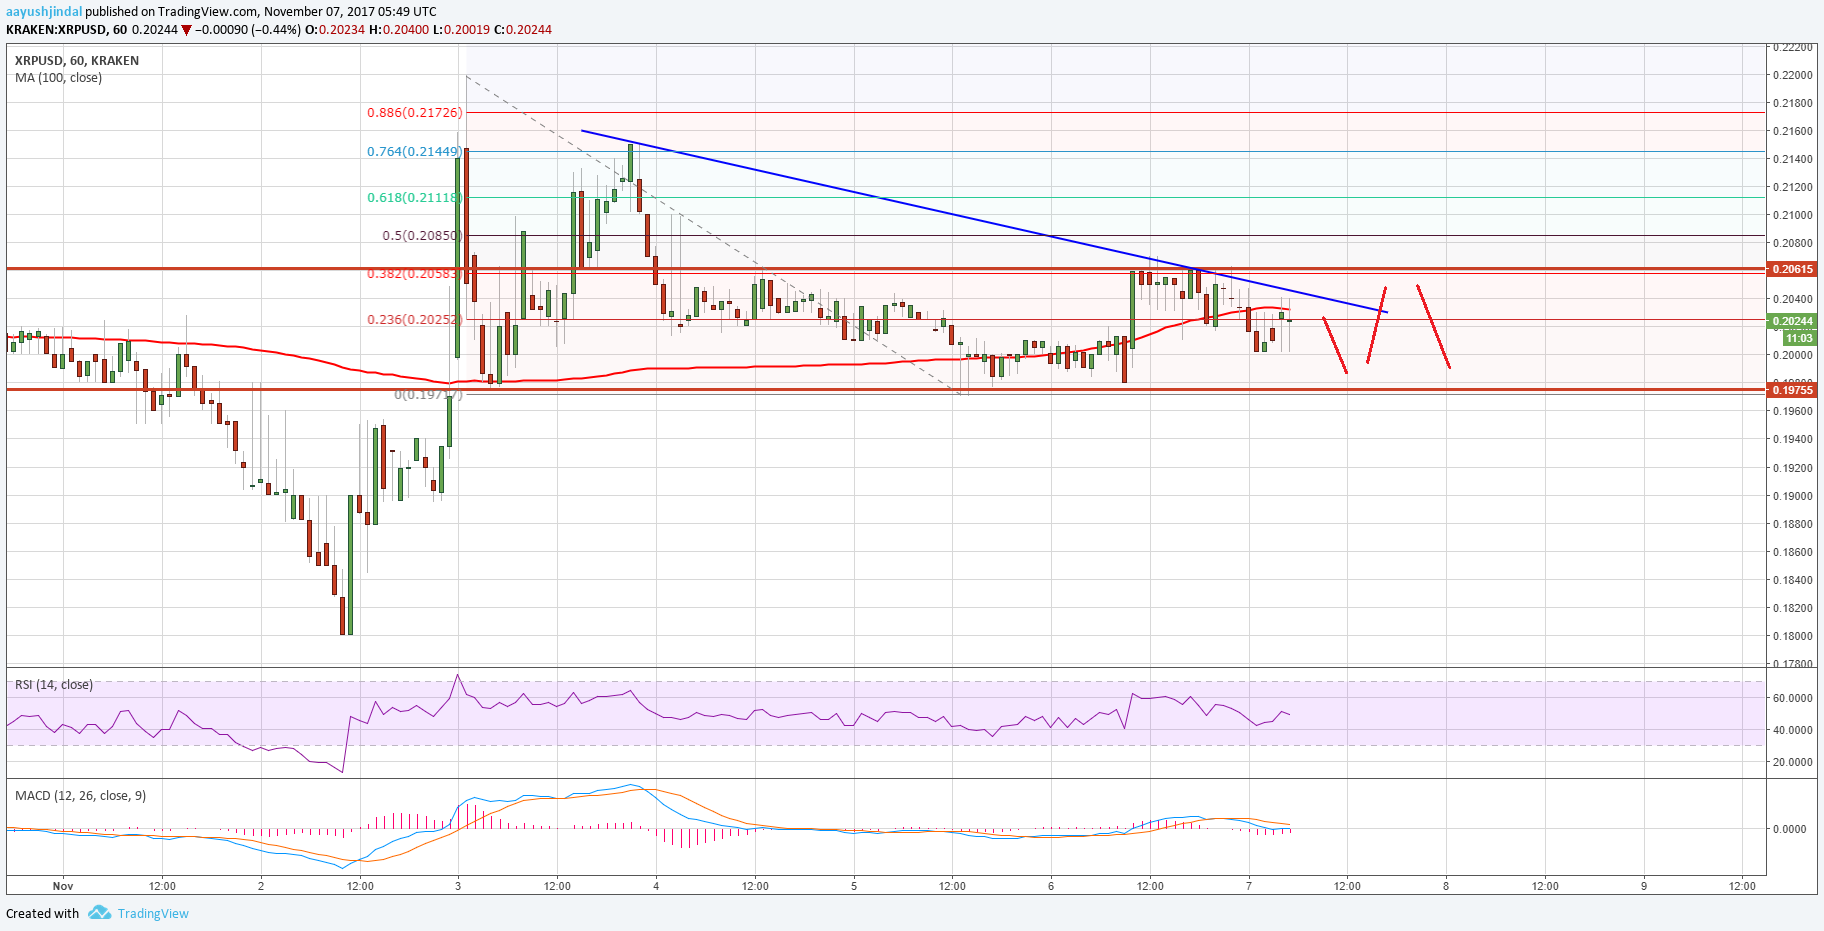
A close above $0.2040 would call for a test of the 50% Fib retracement level of the last decline from the $0.2180 high to $0.1971 low. A successful close above $0.2050 followed by $0.2100 is needed for buyers to push the price towards $0.2180 and $0.2200. On the downside, the $0.1975 range support holds a lot of importance followed by $0.1960.
Looking at the technical indicators:
Hourly MACD – The MACD for XRP/USD is almost flat in the bearish zone.
Hourly RSI (Relative Strength Index) – The RSI for XRP/USD is just above the 50 level.
Major Support Level – $0.1975
Major Resistance Level – $0.2040
Charts courtesy – Trading View, Kraken
SaveSave


