
Reason to trust
How Our News is Made
Strict editorial policy that focuses on accuracy, relevance, and impartiality
Ad discliamer
Morbi pretium leo et nisl aliquam mollis. Quisque arcu lorem, ultricies quis pellentesque nec, ullamcorper eu odio.
Key Highlights
- Ripple price is recovering and recently moved above the $0.2040 level against the US Dollar.
- Yesterday’s highlighted two bearish trend lines with resistance at $0.2040 were broken on the hourly chart of the XRP/USD pair (data source from Kraken).
- The price is currently above the 100 hourly simple moving average and $0.2050, which is a positive sign.
Ripple price is gaining pace against the US Dollar and Bitcoin. XRP/USD might continue to move higher toward the $0.2100 and $0.2150 levels.
Ripple Price Support
It seems like a decent recovery is triggered from the $0.1970 swing low in Ripple price against the US Dollar. The price has managed to move above a couple of important resistances such as $0.2000 and $0.2030. There was a push above the 38.2% Fib retracement level of the last drop from the $0.2238 high to $0.1900 low. It opened the doors for more gains, and the price settled above the 100 hourly simple moving average and $0.2050.
The best part was a break above yesterday’s highlighted two bearish trend lines with resistance at $0.2040 on the hourly chart of the XRP/USD pair. The pair is now above the 50% Fib retracement level of the last drop from the $0.2238 high to $0.1900 low. It might continue to gain pace toward $0.2100 in the near term. Any corrections or dips from the current levels might find support near $0.2040 and the 100 hourly simple moving average.
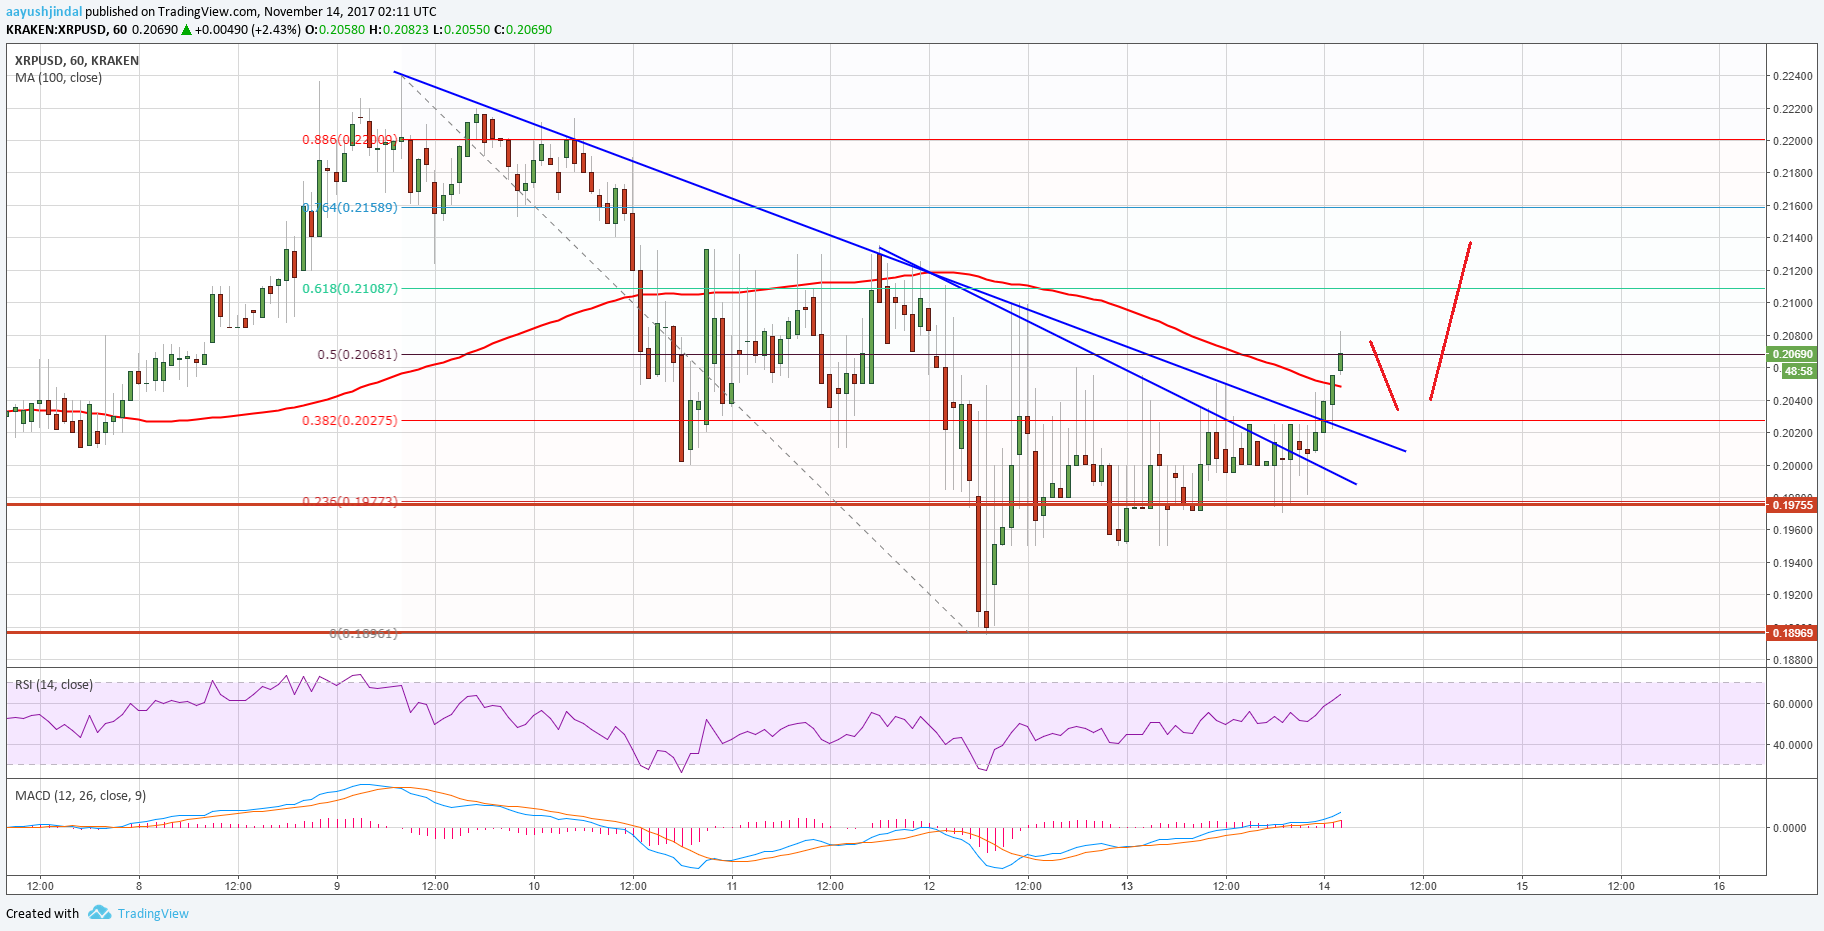
Moreover, the broken trend lines could provide support near $0.2020 followed by $0.2000. Therefore, there are chances of more gains in XRP as long as the price is above the $0.2000 level.
Looking at the technical indicators:
Hourly MACD – The MACD for XRP/USD is gaining pace in the bullish zone.
Hourly RSI (Relative Strength Index) – The RSI for XRP/USD is well above the 50 level and moving higher.
Major Support Level – $0.2040
Major Resistance Level – $0.2150
Charts courtesy – Trading View, Kraken


