
Reason to trust
How Our News is Made
Strict editorial policy that focuses on accuracy, relevance, and impartiality
Ad discliamer
Morbi pretium leo et nisl aliquam mollis. Quisque arcu lorem, ultricies quis pellentesque nec, ullamcorper eu odio.
Key Highlights
- Ripple price is still above the all-important $0.1960-50 support area against the US Dollar.
- There is a bearish trend line forming with resistance at $0.2030 on the hourly chart of the XRP/USD pair (data source from Kraken).
- The price seems to be preparing for the next break either above $0.2050 or below $0.1960.
Ripple price is holding key support levels against the US Dollar and Bitcoin. XRP/USD is above the $0.1950 support and preparing for the next break.
Ripple Price Support
There were mostly ranging moves in Ripple price above the $0.1950 support against the US Dollar. Buyers failed and there was also no upside break since buyers struggled to place the price above the $0.2050 resistance. There was a correction wave initiated from the $0.2168 swing high and the price declined back below $0.2100. However, the downside move was protected by the 50% Fib retracement level of the last leg up from the $0.1845 low to $0.2168 high.
Moreover, the 100 hourly simple moving average is near $0.2020 and holding the current downside wave. Below $0.2020, there is a crucial support area near $0.1960-50. The mentioned $0.1950 acted as a strong buy zone on many occasions and would continue to hold downsides in the short term. At the moment, a bearish trend line forming with resistance at $0.2030 on the hourly chart of the XRP/USD pair is preventing gains.
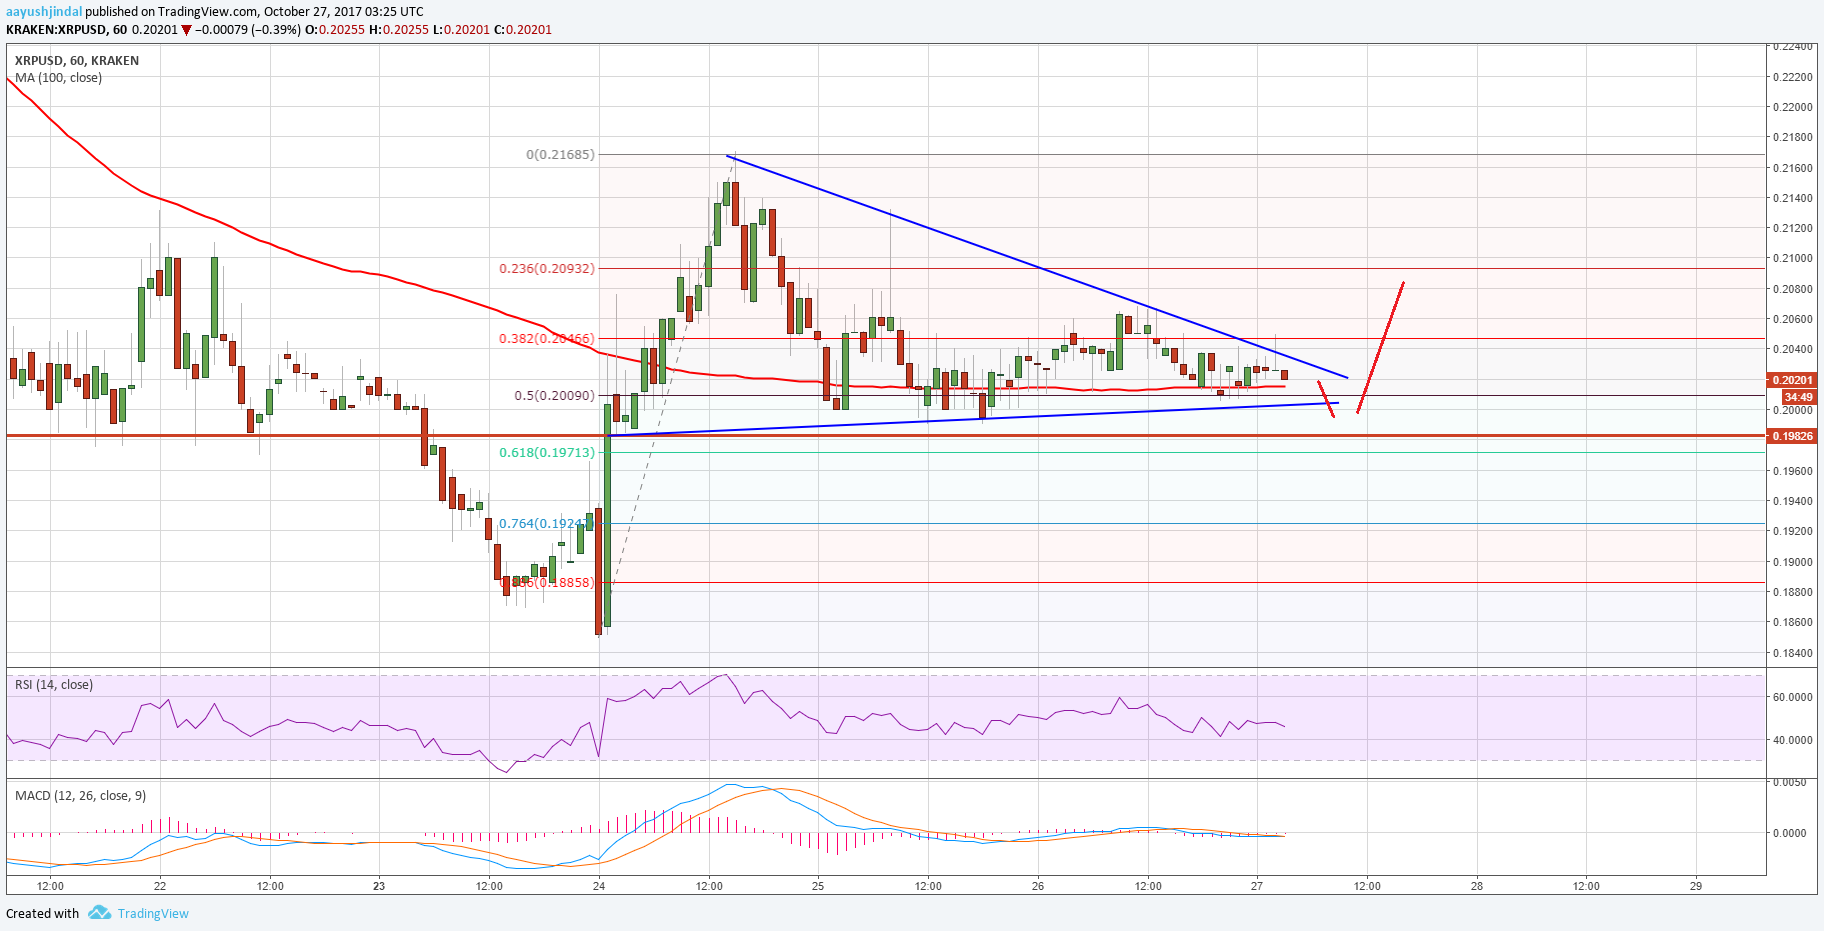
A proper close above $0.2030 and $0.2050 could ignite an upside move. The next major resistance would be the last swing high at $0.2168. Overall, as long as the price is above $0.1950, it remains supported for more gains in the near term towards $0.2165-68.
Looking at the technical indicators:
Hourly MACD – The MACD for XRP/USD is currently flat in the bullish zone.
Hourly RSI (Relative Strength Index) – The RSI for XRP/USD is currently moving lower and is below the 50 level.
Major Support Level – $0.1960
Major Resistance Level – $0.2030
Charts courtesy – Trading View, Kraken
SaveSave


