
Reason to trust
How Our News is Made
Strict editorial policy that focuses on accuracy, relevance, and impartiality
Ad discliamer
Morbi pretium leo et nisl aliquam mollis. Quisque arcu lorem, ultricies quis pellentesque nec, ullamcorper eu odio.
Key Highlights
- Ripple price is placed nicely above the $0.2000 handle against the US Dollar and eyes further gains.
- There is a contracting triangle forming with support at $0.2040 on the hourly chart of the XRP/USD pair (data source from Kraken).
- The price is holding the bullish bias and it might attempt an upside break above $0.2100.
Ripple price remains in the bullish zone against the US Dollar and Bitcoin. XRP/USD needs to gather pace above $0.2100 for more gains.
Ripple Price Trend
There were decent gains in Ripple price this week above $0.2000 against the US Dollar. The price is currently placed well in the bullish zone and looks set to break the $0.2100 level sooner or later. It corrected nicely from the $0.1900 swing low and also moved above the 38.2% Fib retracement level of the last leg down from the $0.2240 high to $0.1898 low.
However, the price seems to be finding sellers near the $0.2080 and $0.2100 levels. Moreover, the 50% Fib retracement level of the last leg down from the $0.2240 high to $0.1898 low is preventing further upsides. At present, the price is above the 100 hourly simple moving average and $0.2000. However, it has to move above the $0.2100 level for further gains. Moreover, there is a contracting triangle forming with support at $0.2040 on the hourly chart of the XRP/USD pair.
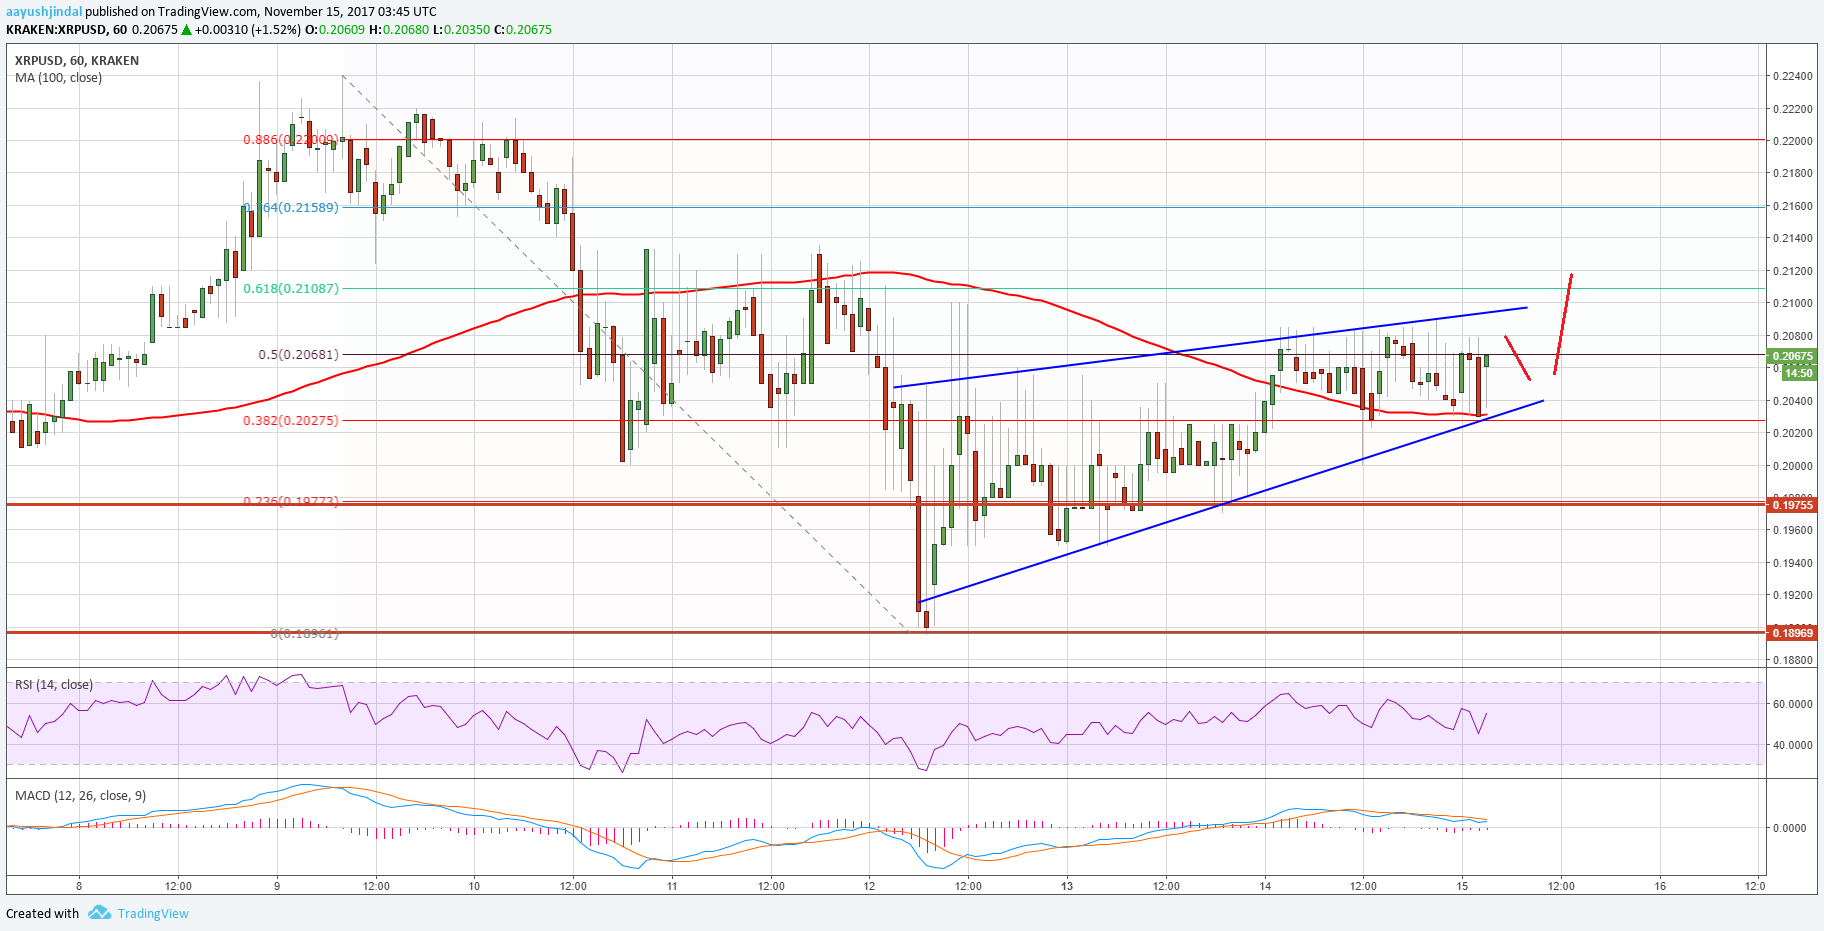
A break above the contracting triangle resistance at $0.2100 would open the doors for more gains. The next stop for buyers could be near $0.2200. On the downside, the $0.2040 level is a major support area. Below $0.2040, the next major support is near the $0.2000 handle.
Looking at the technical indicators:
Hourly MACD – The MACD for XRP/USD is currently struggling to move into the bullish zone.
Hourly RSI (Relative Strength Index) – The RSI for XRP/USD is currently heading higher and is above the 50 level.
Major Support Level – $0.2040
Major Resistance Level – $0.2100
Charts courtesy – Trading View, Kraken


