
Reason to trust
How Our News is Made
Strict editorial policy that focuses on accuracy, relevance, and impartiality
Ad discliamer
Morbi pretium leo et nisl aliquam mollis. Quisque arcu lorem, ultricies quis pellentesque nec, ullamcorper eu odio.
Key Highlights
- Ripple price is placed well above the $0.2150 support and eyeing further gains against the US Dollar.
- There is a new connecting bullish trend line forming with support at $0.2180 on the hourly chart of the XRP/USD pair (data source from Kraken).
- The price is likely to move higher and it could even break the $0.2250 resistance in the near term.
Ripple price is eyeing more gains against the US Dollar and Bitcoin. XRP/USD might break higher above the $0.2250 level to test $0.2300.
Ripple Price Support
It seems like Ripple price is forming a decent support base above $0.2150 against the US Dollar. The price even settled above the $0.2180 level and recently traded as high as $0.2240. After trading near $0.2240, the price started a downside correction and traded below the 23.6% Fib retracement level of the last wave from the $0.2000 low to $0.2240 high.
The downside move was limited since the $0.2120 support held losses. Moreover, the 50% Fib retracement level of the last wave from the $0.2000 low to $0.2240 high acted as a major support. It seems like there is a new connecting bullish trend line forming with support at $0.2180 on the hourly chart of the XRP/USD pair. The pair is following the trend line and is currently placed above the $0.2200 level. It might soon gain pace and attempt an upside break above the $0.2250 level in the near term.
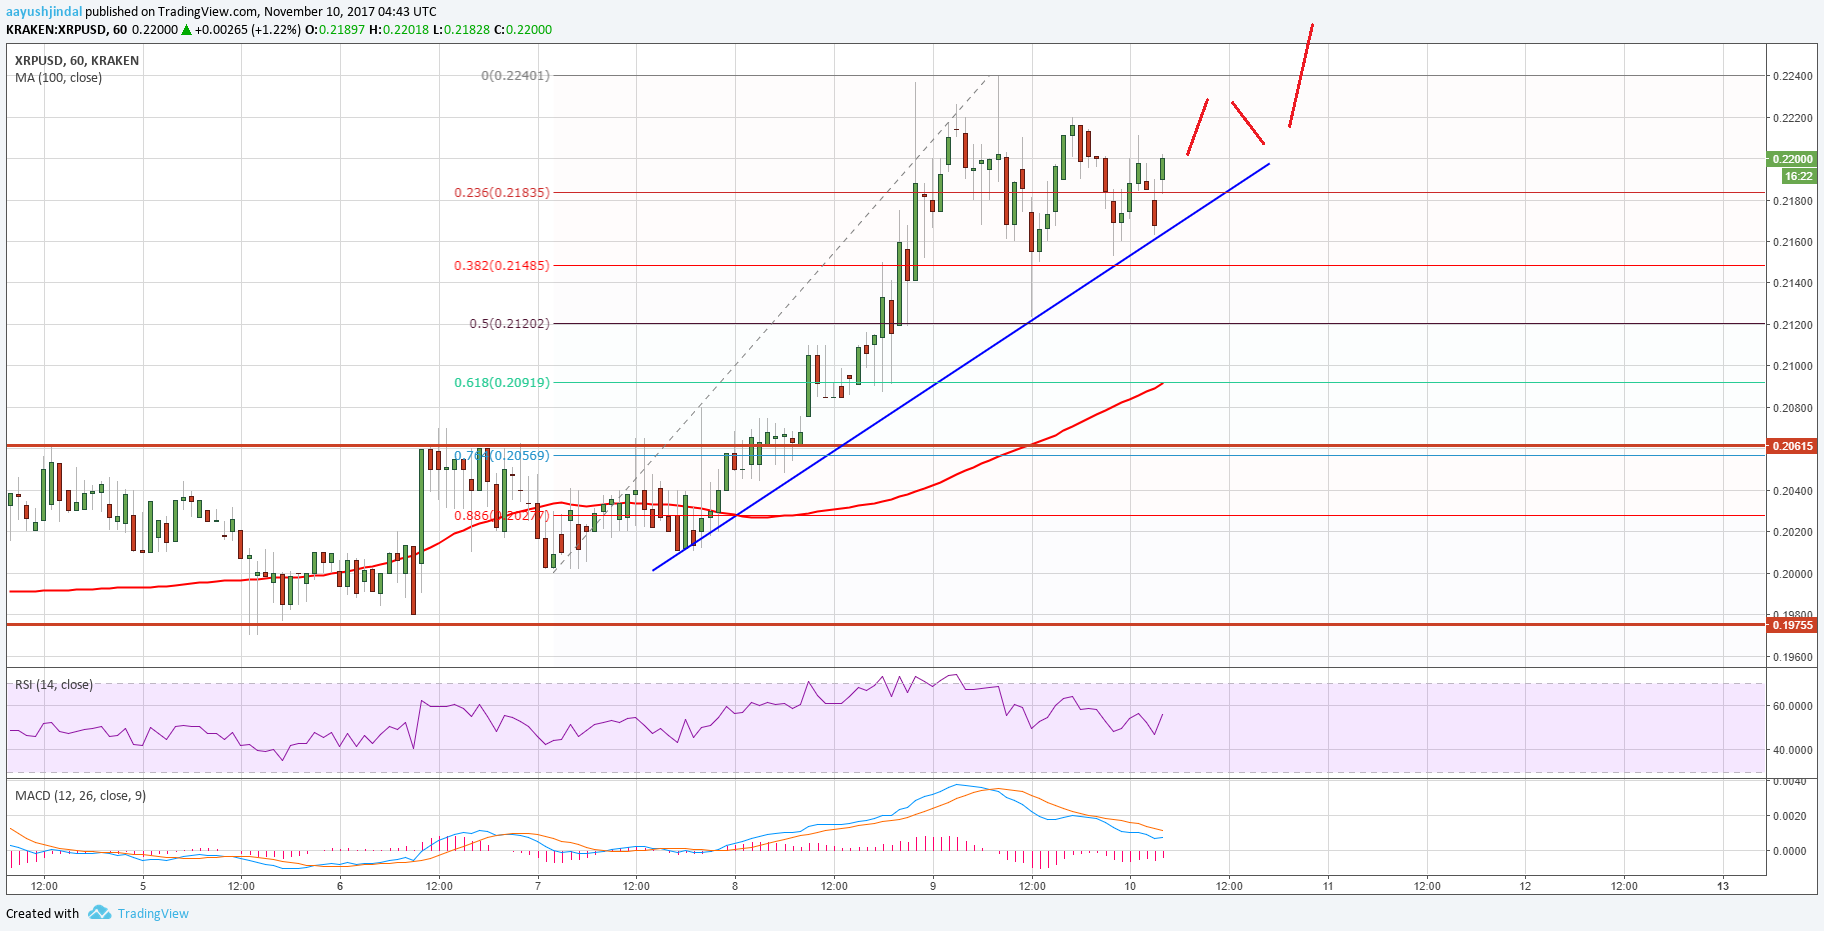
The next upside hurdle is near $0.2300 where sellers might appear. On the downside, the $0.2150 support is important along with the trend line. Only a close below $0.2120 would call for a test of the next support at $0.2000.
Looking at the technical indicators:
Hourly MACD – The MACD for XRP/USD is attempting to move back in the bullish zone.
Hourly RSI (Relative Strength Index) – The RSI for XRP/USD is above the 50 level and heading higher.
Major Support Level – $0.2180
Major Resistance Level – $0.2250
Charts courtesy – Trading View, Kraken


