
Reason to trust
How Our News is Made
Strict editorial policy that focuses on accuracy, relevance, and impartiality
Ad discliamer
Morbi pretium leo et nisl aliquam mollis. Quisque arcu lorem, ultricies quis pellentesque nec, ullamcorper eu odio.
Key Highlights
- Ripple price failed to hold an important support at $0.1960 against the US Dollar and moved down.
- This week’s highlighted major channel with support at $0.1960 was broken on the hourly chart of the XRP/USD pair (data source from Kraken).
- The price is currently trading near the $0.1880 support and attempting an upside recovery.
Ripple price declined substantially against the US Dollar and Bitcoin. XRP/USD broke $0.1950, which may now act as a resistance in the short term.
Ripple Price Resistance
This week, we followed a major support area at $0.1960-0.1950 in Ripple price against the US Dollar. There were many attempts by sellers to break $0.1950, but they failed. Similarly, buyers failed to push the price above $0.2050. At the end, sellers had the upper hand as they succeeded in breaking the $0.1950 support area. The worst part was the fact that this week’s highlighted major channel with support at $0.1960 was broken on the hourly chart of the XRP/USD pair.
It opened the doors for more slides and the pair traded below $0.1900. A low as formed at $0.1880 recently from where the pair is currently attempting a correction. An initial resistance is around the 23.6% Fib retracement level of the last drop from the $0.2050 high to $0.1880 low. However, the most important resistance is near $0.1960 and $0.1950. Moreover, the 50% Fib retracement level of the last drop from the $0.2050 high to $0.1880 low is at $0.1964.
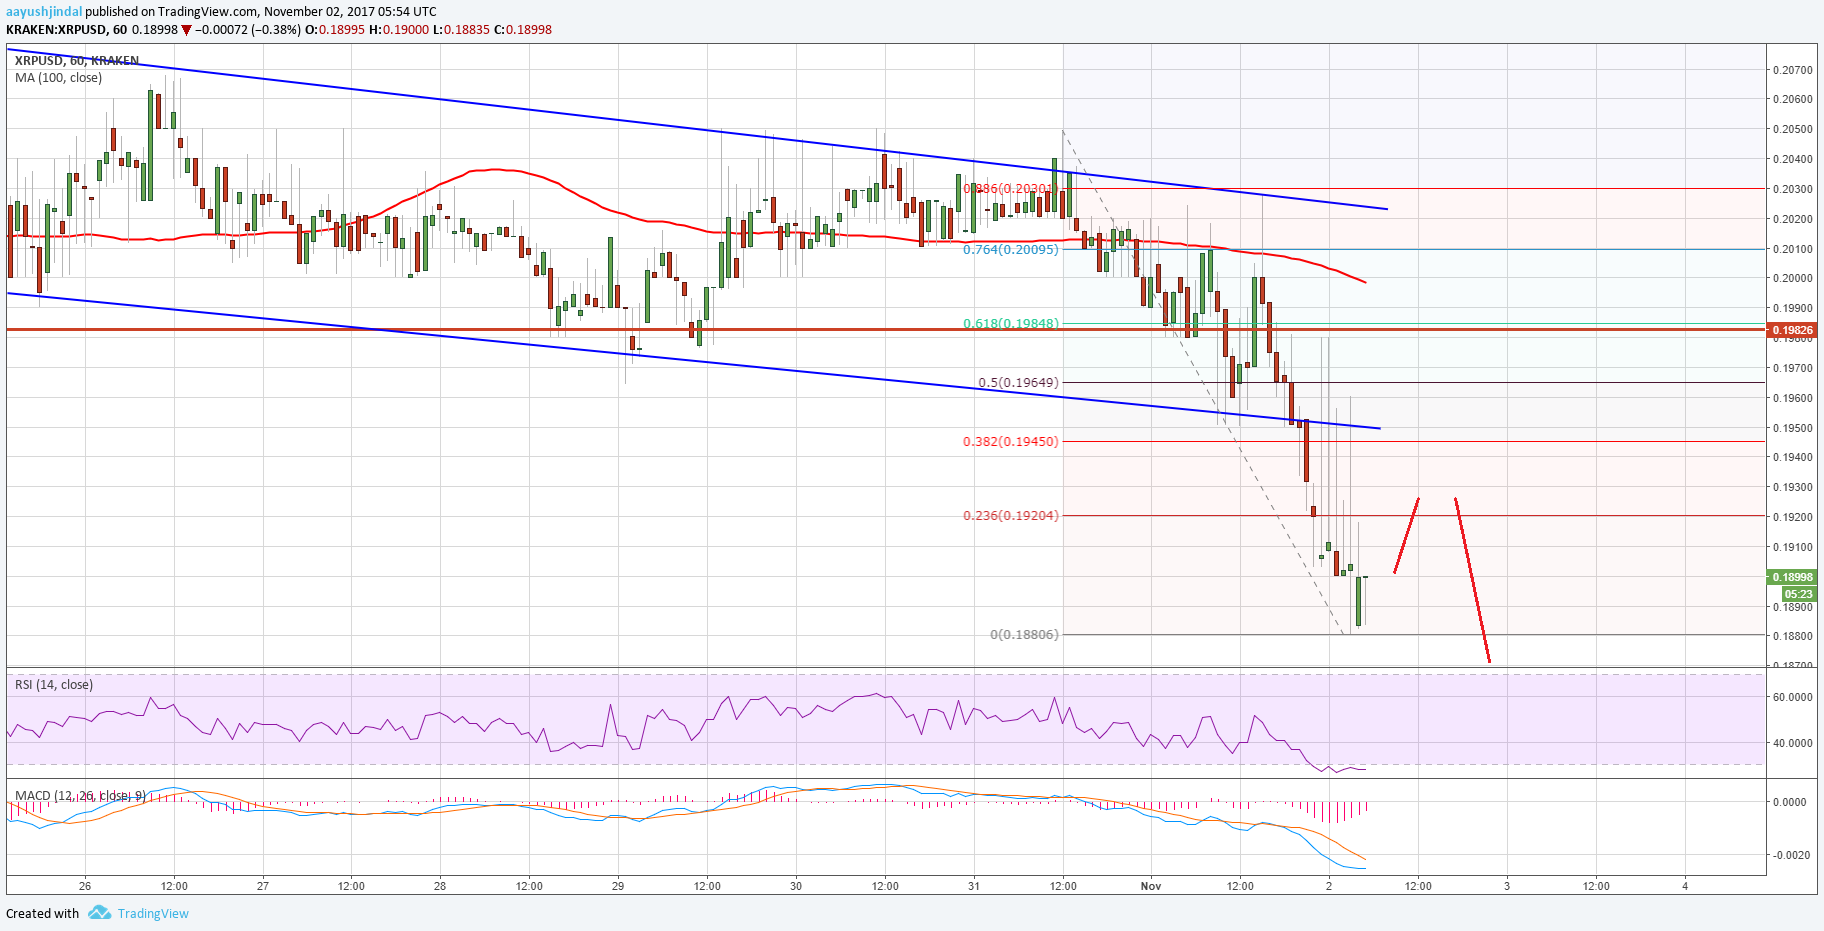
Therefore, any corrections from the current levels are likely to find barrier at $0.1960. On the downside, the recent low at $0.1880 is a decent support. A break of $0.1880 would call for a test of $0.1800.
Looking at the technical indicators:
Hourly MACD – The MACD for XRP/USD is currently reducing the bearish zone.
Hourly RSI (Relative Strength Index) – The RSI for XRP/USD is currently in the oversold region.
Major Support Level – $0.1880
Major Resistance Level – $0.1960
Charts courtesy – Trading View, Kraken


