
Reason to trust
How Our News is Made
Strict editorial policy that focuses on accuracy, relevance, and impartiality
Ad discliamer
Morbi pretium leo et nisl aliquam mollis. Quisque arcu lorem, ultricies quis pellentesque nec, ullamcorper eu odio.
Key Highlights
- Ripple price is moving higher once again and is currently above the $0.7500 support against the US Dollar.
- This is a short-term ascending channel forming with support at $0.7700 on the hourly chart of the XRP/USD pair (data source from Kraken).
- The pair might continue to move higher and it could even break $0.8400 for more gains.
Ripple price is gaining pace against the US Dollar and Bitcoin. XRP/USD might continue to gain pace above the $0.9000 level in the near term.
Ripple Price Trend
It seems like Ripple price has completed a correction wave at $0.7000 against the US Dollar. The price has started a fresh upside wave and moved above the $0.7250 resistance. Buyers also succeeded in pushing the price above the 50% Fib retracement level of the last drop from the $0.9000 high to $0.6105 low. More importantly, the price is above the $0.7500 level and the 100 hourly simple moving average.
It recently traded as high as $0.8398 and is currently correcting lower. It seems like there is a short-term ascending channel forming with support at $0.7700 on the hourly chart of the XRP/USD pair. An initial support on the downside is around the 23.6% Fib retracement level of the last wave from the $0.6005 low to $0.8398 high. However, there are many supports on the downside such as $0.7700. The mentioned $0.7700 support also coincides with the 38.2% Fib retracement level of the last wave from the $0.6005 low to $0.8398 high.
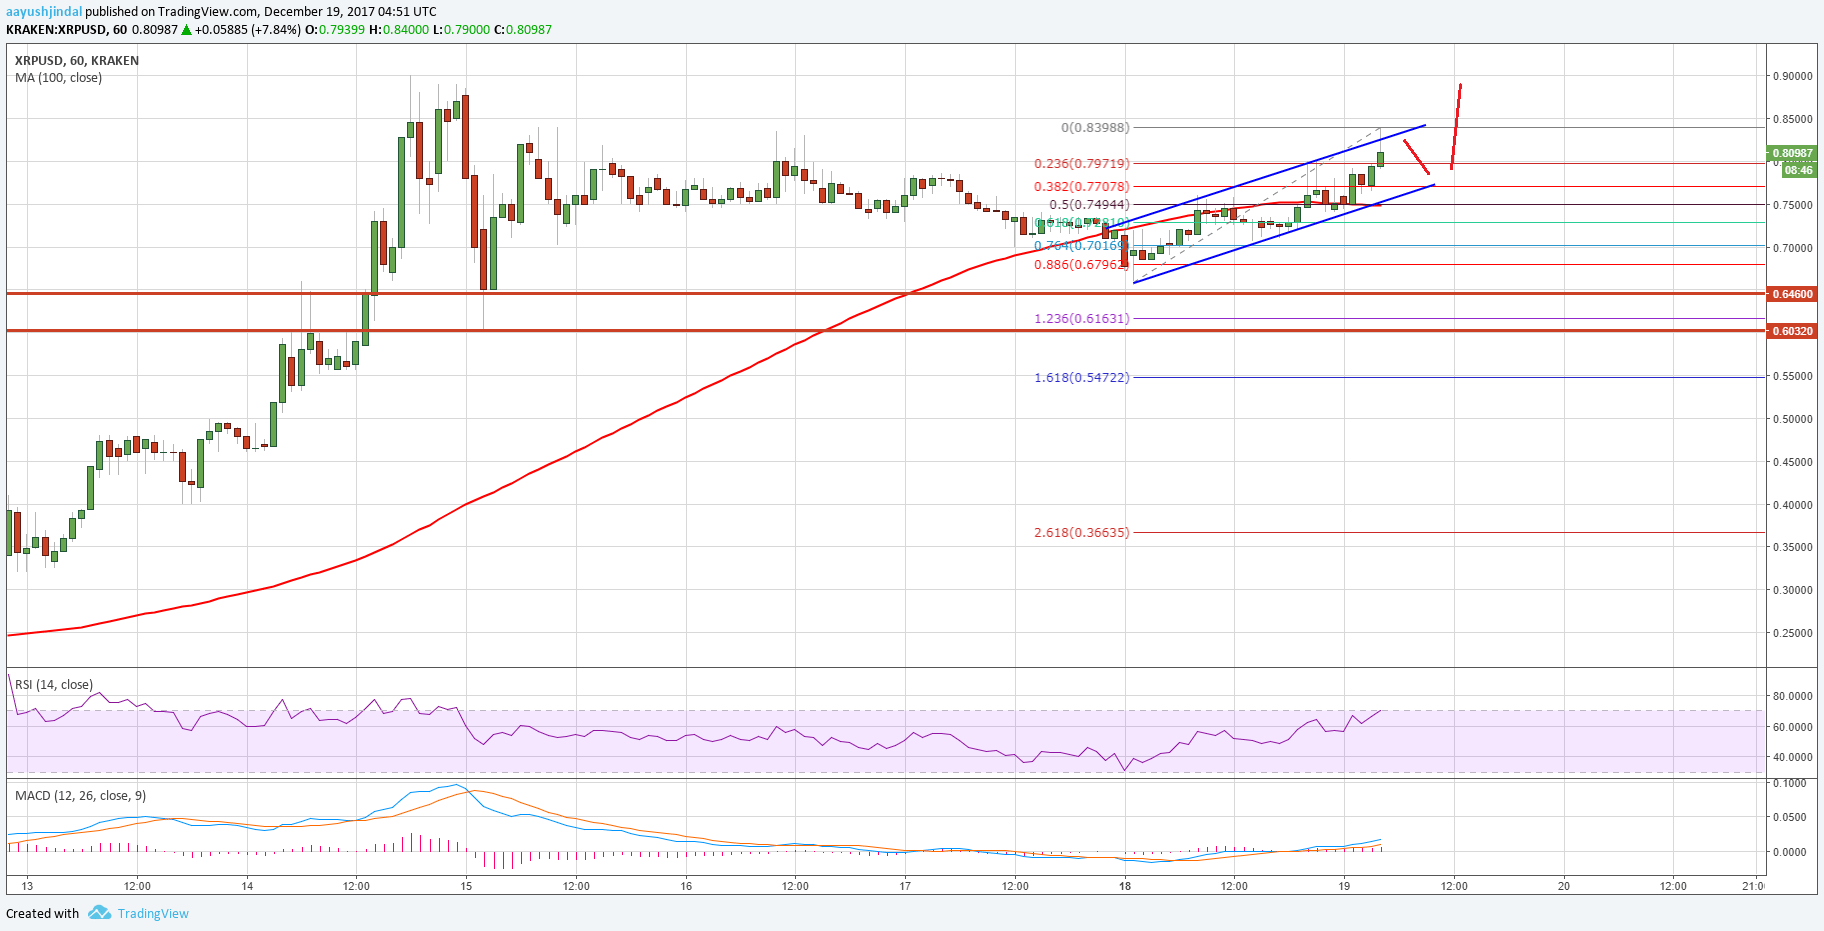
A break above the channel resistance at $0.8400 is required for buyers to gain further momentum. Above $0.8400, the price could trade back towards the $0.9000 high in the near term.
Looking at the technical indicators:
Hourly MACD – The MACD for XRP/USD is back in the bullish zone.
Hourly RSI (Relative Strength Index) – The RSI for XRP/USD is heading higher towards the 70 level.
Major Support Level – $0.7700
Major Resistance Level – $0.8400
Charts courtesy – Trading View, Kraken


