
Reason to trust
How Our News is Made
Strict editorial policy that focuses on accuracy, relevance, and impartiality
Ad discliamer
Morbi pretium leo et nisl aliquam mollis. Quisque arcu lorem, ultricies quis pellentesque nec, ullamcorper eu odio.
Key Highlights
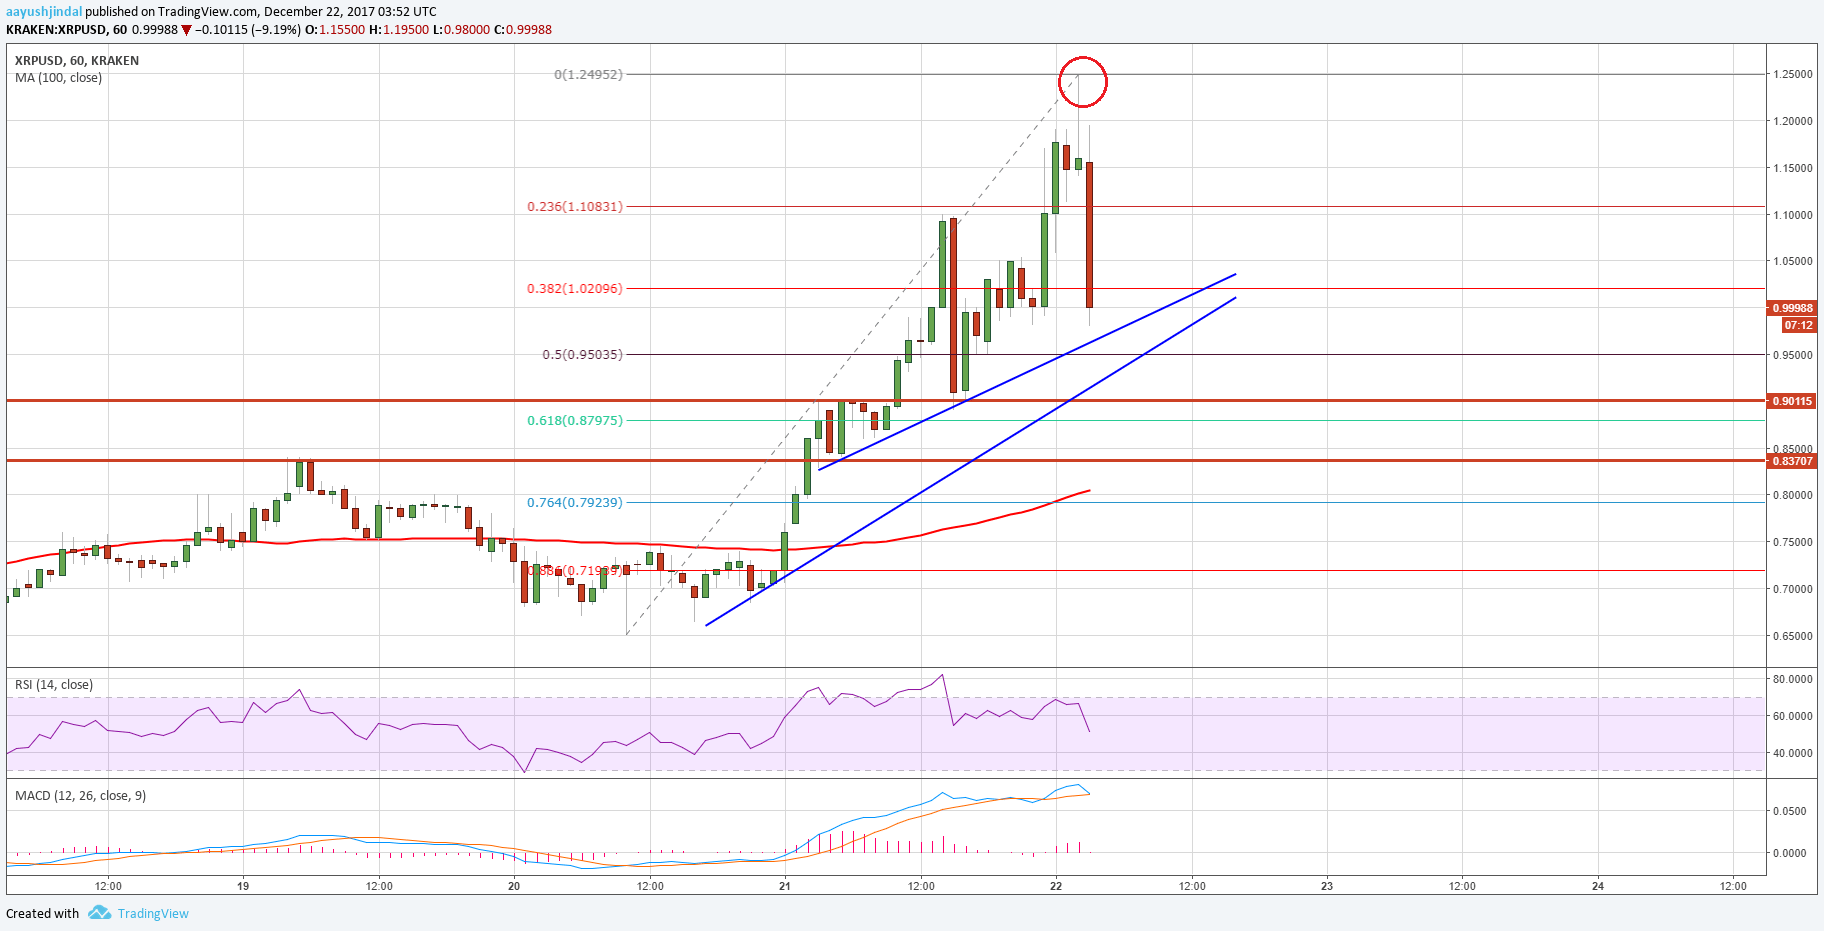
- Ripple price surged above the $1.00 level and traded as high as $1.24 against the US Dollar.
- There are two bullish trend lines forming with support at $0.9500 on the hourly chart of the XRP/USD pair (data source from Kraken).
- The pair is currently correcting sharply lower and may soon test the $0.9500 and $0.9000 supports.
Ripple price after an upside surge above $1.20 against the US Dollar faced sellers, also versus Bitcoin. XRP/USD is moving down toward the $0.9000 support.
Ripple Price Correction
There was a solid rise in Ripple price above the $1.00 handle against the US Dollar. The price made a nice upside move and traded above the $1.10 and $1.20 resistance levels. It traded to a new all-time high at $1.2495 from where a downside correction was initiated. It has moved below the 23.6% Fib retracement level of the last wave from the $0.6500 low to $1.2495 high.
It seems like the current correction may extend toward the $0.9000 level. On the downside, there are two bullish trend lines forming with support at $0.9500 on the hourly chart of the XRP/USD pair. The trend lines support is also around the 50% Fib retracement level of the last wave from the $0.6500 low to $1.2495 high. Therefore, the $0.9000 level is a major support and it will most likely prevent downside move in the near term. Below $0.9000, the price could extend declines toward the 61.8% Fib retracement level of the last wave from the $0.6500 low to $1.2495 high at $0.8790.
On the upside, the price may move back above $1.00. However, the next major resistances are at $1.20 and $1.25 in the short term.
Looking at the technical indicators:
Hourly MACD – The MACD for XRP/USD is placed nicely in the bullish zone.
Hourly RSI (Relative Strength Index) – The RSI for XRP/USD is moving lower sharply toward the 50 level.
Major Support Level – $0.9000
Major Resistance Level – $1.2000
Charts courtesy – Trading View, Kraken


