
Reason to trust
How Our News is Made
Strict editorial policy that focuses on accuracy, relevance, and impartiality
Ad discliamer
Morbi pretium leo et nisl aliquam mollis. Quisque arcu lorem, ultricies quis pellentesque nec, ullamcorper eu odio.
Key Highlights
- Ripple price traded above the $1.08 level yesterday before starting a new downside against the US dollar.
- There is a short-term connecting bullish trend line forming with support at $0.9350 on the hourly chart of the XRP/USD pair (data source from Kraken).
- The pair must stay above the $0.9300 level to avoid further declines in the near term.
Ripple price started a fresh downside wave against the US Dollar and Bitcoin. XRP/USD has to move above $0.9800 to move back in the bullish zone.
Ripple Price Support
There was an extension of yesterday’s move above $1.03 in Ripple price against the US Dollar. The price traded above the $1.05 and $1.08 resistance levels. It traded close to the $1.10 level and formed a high at $1.096 before sellers appeared. Later, a downside move was initiated and the price declined sharply below $1.05. There was a break below the 50% Fib retracement level of the last upside wave from the $0.8846 low to $1.0962 high.
Moreover, there was a break below the $0.9800 support level. However, the downside move was protected by the $0.9300 support and the 100 hourly simple moving average. The 76.4% Fib retracement level of the last upside wave from the $0.8846 low to $1.0962 high also acted as a support. Furthermore, there is a short-term connecting bullish trend line forming with support at $0.9350 on the hourly chart of the XRP/USD pair. The trend line support, $0.9300 and the 100 hourly SMA are acting as crucial supports and preventing declines.
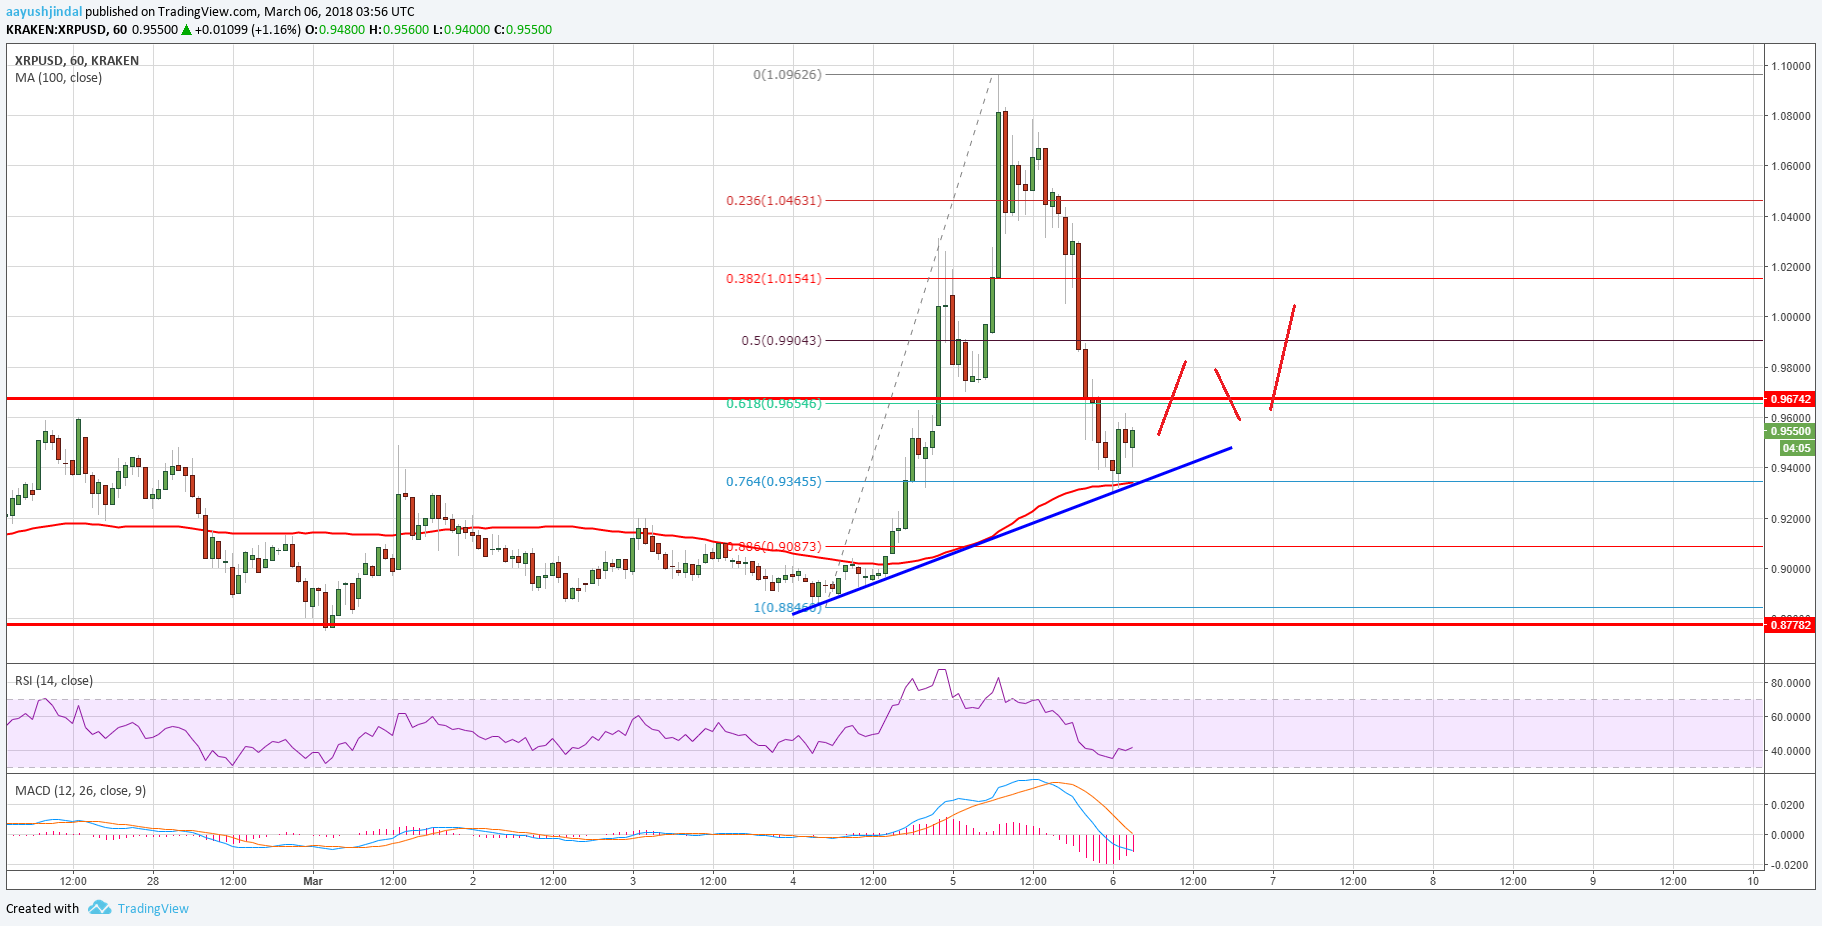
As long as the price is above $0.9300, it may bounce back. On the upside, a break above the $0.9800 level is needed for the price to move back towards $1.0300.
Looking at the technical indicators:
Hourly MACD – The MACD for XRP/USD is reducing the last bearish slope.
Hourly RSI (Relative Strength Index) – The RSI for XRP/USD is correcting higher from the 30 level.
Major Support Level – $0.9300
Major Resistance Level – $0.9800
Charts courtesy – Trading View


