
Reason to trust
How Our News is Made
Strict editorial policy that focuses on accuracy, relevance, and impartiality
Ad discliamer
Morbi pretium leo et nisl aliquam mollis. Quisque arcu lorem, ultricies quis pellentesque nec, ullamcorper eu odio.
Key Highlights
- Ripple price started a downside correction after trading above the $3.30 level against the US Dollar.
- Yesterday’s highlighted important bullish trend line with support at $2.40 is intact on the hourly chart of the XRP/USD pair (data source from Kraken).
- The pair might continue to hold the $2.40-2.30 support area and it could even bounce back.
Ripple price is currently correcting lower against the US Dollar and Bitcoin. XRP/USD is testing an important support at $2.30 and it could bounce back.
Ripple Price Support
There was an extension to yesterday’s move in Ripple price as it moved above the $3.00 level against the US Dollar. The price even traded above the $3.30 level and posted a new all-time high of $3.3385. Later, a downside correction was initiated and the price moved below the $3.00 support. It also traded below a trend line support at $2.80. Moreover, there was a push below the 50% Fib retracement level of the last wave from the $2.15 low to $3.331 high.
However, the downside wave was protected by the $2.40 support. In addition, yesterday’s highlighted important bullish trend line with support at $2.40 is intact on the hourly chart of the XRP/USD pair. It is acting as a major support and preventing declines below $2.30. More importantly, the 100 hourly simple moving average is also around $2.40 and is acting as a major hurdle for more losses.
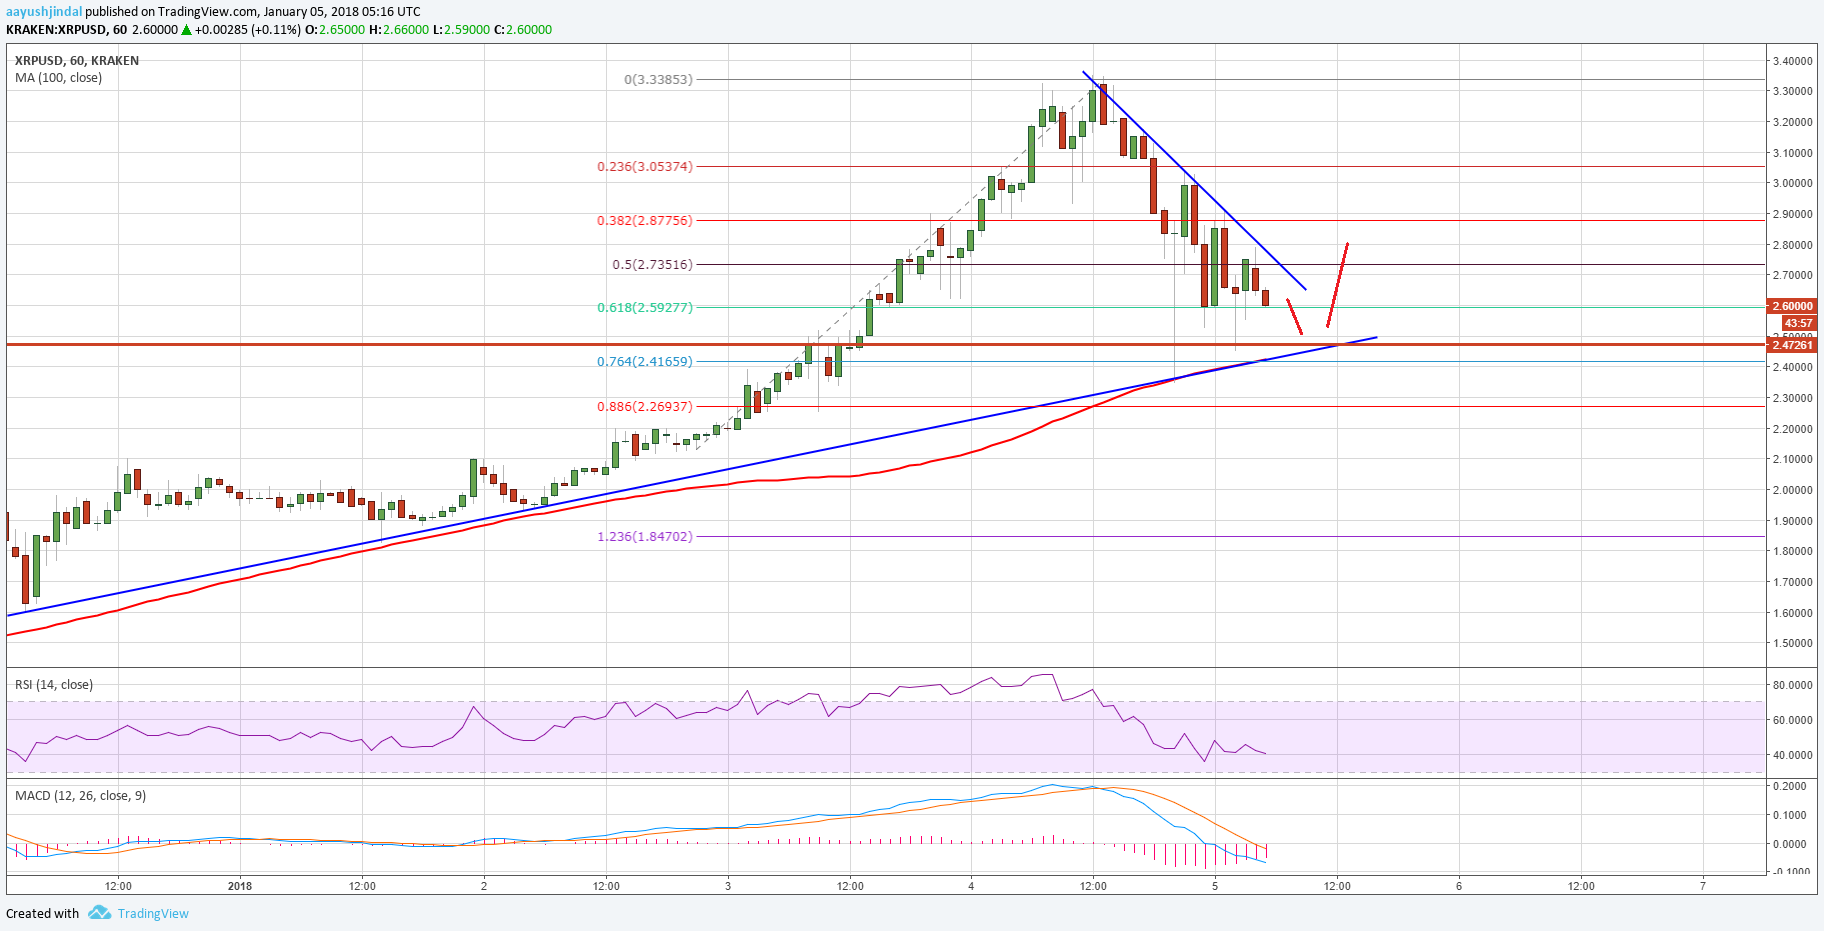
At the moment, the price is trading around the 61.8% Fib retracement level of the last wave from the $2.15 low to $3.331 high. It has to hold the $2.30-2.40 support. On the upside, a break above a connecting bearish trend line at $2.70 is needed for a bounce back.
Looking at the technical indicators:
Hourly MACD – The MACD for XRP/USD is reducing its recent bearish slope.
Hourly RSI (Relative Strength Index) – The RSI for XRP/USD is near 40 and is moving down.
Major Support Level – $2.30
Major Resistance Level – $2.70
Charts courtesy – Trading View, Kraken


